

Dow Jones Industrial Average backslides on NFP Friday as consumer sentiment falls
- The Dow Jones shed 300 points after US NFP figures missed the mark.
- US consumer inflation fears rose, while their outlook deteriorated.
- US President Donald Trump puts tariffs back on the board.
The Dow Jones Industrial Average (DJIA) took a fresh beating on Friday after Nonfarm Payrolls (NFP) missed market forecasts, and the University of Michigan’s (UoM) Consumer Sentiment Index showed a sharp downturn in consumers’ overall economic outlook. United States (US) President Donald Trump also put his long-awaited trade war back on the table, dropping hints of things to come with threats of reciprocal tariffs on countries that have their own tariffs on US goods.
US NFP preliminary payrolls came in softer than expected in January, adding a net 143K new worker positions over the month, even lower than the forecast 170K. Still, it wasn’t all bad news on the labor front: December’s NFP print was revised significantly higher to 307K, and the Unemployment Rate ticked back down to 4.0% from 4.1%.
The UoM Consumer Sentiment Index for January contracted sharply to a new seven-month low of 67.8 as US consumers turned increasingly gloomy on their economic outlook. The sentiment index’s last score was 71.1. According to the UoM’s comprehensive survey results, US consumers are also battling renewed inflation fears with 12-month inflation expectations jumping to 4.3% versus the last print of 3.3%. Higher inflation expectations are taking root, with 5-year inflation expectations also ticking higher to 3.3% from 3.2%.
US President Donald Trump hit markets with a fresh round of rambling tariff threats, just to keep investors and markets on their toes and remind everyone that his plan is still to address the US’ debt problems with import fees on his own citizens. The President signed an executive order to begin preparing for de minimis, or minuscule, tariffs on China that are largely symbolic in nature, but promised via social media that he is preparing a wider package of reciprocal tariffs on “many countries”.
Dow Jones news
Market sentiment whipsawed on Friday, churning in both directions before getting jolted lower by fresh trade war headlines. Most of the Dow Jones equity board has turned lower, with thin gains getting overshadowed by steep losses from Amazon (AMZN).
Amazon posted better-than-expected earnings and revenue in Q4, but the megacompany also cautioned that headwinds may be on the horizon. It lowered its forward guidance for Q1 and sent investors running for the hills. Amazon's stock dropped 3.5% on Friday, sinking to $230 per share.
Dow Jones price forecast
The Dow Jones has extended into a second straight down day, shedding 300 points and falling back to the 44,400 region. The 44,000 handle is back in view, and the index is down over 1.5% from another failed attempt to muscle the major equity index over the 45,000 key price level. The immediate target for a bearish retracement is parked at the 50-day Exponential Moving Average (EMA) near 43,730.
Dow Jones daily chart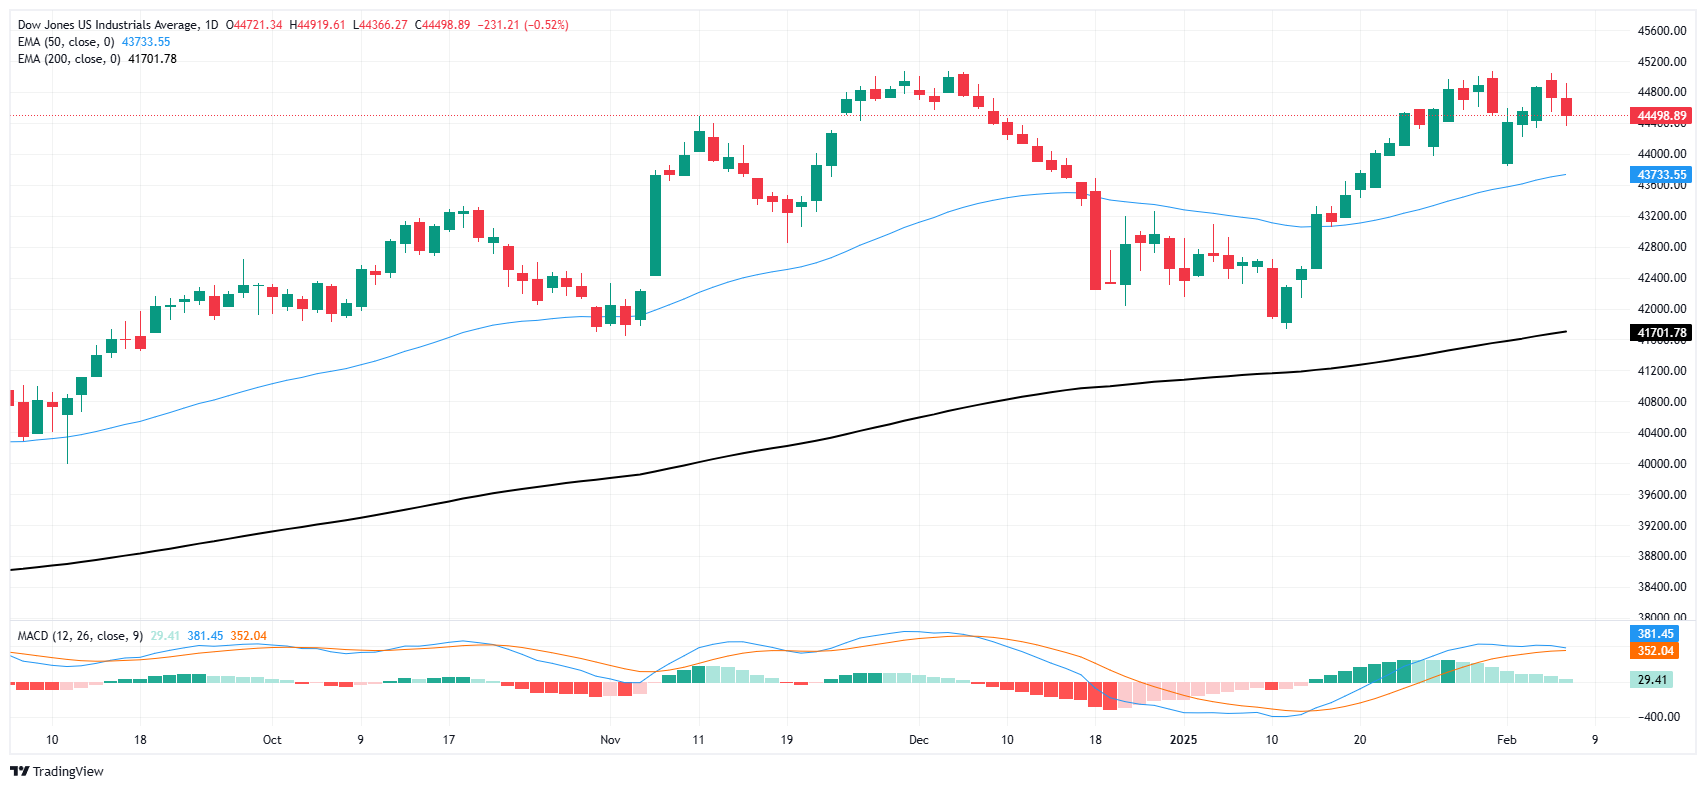
Dow Jones FAQs
The Dow Jones Industrial Average, one of the oldest stock market indices in the world, is compiled of the 30 most traded stocks in the US. The index is price-weighted rather than weighted by capitalization. It is calculated by summing the prices of the constituent stocks and dividing them by a factor, currently 0.152. The index was founded by Charles Dow, who also founded the Wall Street Journal. In later years it has been criticized for not being broadly representative enough because it only tracks 30 conglomerates, unlike broader indices such as the S&P 500.
Many different factors drive the Dow Jones Industrial Average (DJIA). The aggregate performance of the component companies revealed in quarterly company earnings reports is the main one. US and global macroeconomic data also contributes as it impacts on investor sentiment. The level of interest rates, set by the Federal Reserve (Fed), also influences the DJIA as it affects the cost of credit, on which many corporations are heavily reliant. Therefore, inflation can be a major driver as well as other metrics which impact the Fed decisions.
Dow Theory is a method for identifying the primary trend of the stock market developed by Charles Dow. A key step is to compare the direction of the Dow Jones Industrial Average (DJIA) and the Dow Jones Transportation Average (DJTA) and only follow trends where both are moving in the same direction. Volume is a confirmatory criteria. The theory uses elements of peak and trough analysis. Dow’s theory posits three trend phases: accumulation, when smart money starts buying or selling; public participation, when the wider public joins in; and distribution, when the smart money exits.
There are a number of ways to trade the DJIA. One is to use ETFs which allow investors to trade the DJIA as a single security, rather than having to buy shares in all 30 constituent companies. A leading example is the SPDR Dow Jones Industrial Average ETF (DIA). DJIA futures contracts enable traders to speculate on the future value of the index and Options provide the right, but not the obligation, to buy or sell the index at a predetermined price in the future. Mutual funds enable investors to buy a share of a diversified portfolio of DJIA stocks thus providing exposure to the overall index.
추천 기사


