

US Dollar picks up steam and rallies higher ahead of US CPI data
- The US Dollar trades overall in the green against the G10 basket of currencies
- Traders are sending US Treasury rates higher with US CPI data set to be issued on Thursday.
- The US Dollar Index trades above 102.50 and flirts with a break above 103.00.
The US Dollar (USD) rallies again this week, with traders sending US Treasury rates higher ahead of the United States (US) Consumer Price Index (CPI) data for September. Higher US rates make the US Dollar a favored carry currency again, with several traders and speculators more than happy to park their money under the Greenback and get some yield return in the process. It reveals part of the conviction among traders that the US CPI report might see the disinflationary process from recent months stall or even turn around and head back into an increase in inflation.
The economic calendar is thus picking up steam, with the heavy-weight US CPI release on Thursday. Add the weekly Jobless Claims, and markets are bound to have some volatility. The release of the Federal Open Market Committee (FOMC) Minutes of the September meeting on Wednesday showed that a large majority of the Federal Reserve (Fed) voters were in favor of a bigger 50 basis points (bps) rate cut, while a smaller amount voted in favor of a more gradual approach.
Daily digest market movers: Rate differential kicks in again
- US Treasury rates are rallying and are outpacing other sovereign rates, which means that rate differentials are widening again between the US and several other countries. This supports a stronger US Dollar across the board.
- At 12:30 GMT, a bulk load of data points is set to be released:
- US Consumer Price Index data for September:
- Monthly core inflation is expected to grow by 0.2%, compared with 0.3% in August.
- In line with the core reading, monthly headline inflation is expected to increase by 0.1% from 0.2% in August.
- Yearly core inflation is expected to remain steady at 3.2%, while headline inflation should decline to 2.3% from 2.5% in August.
- Initial Jobless Claims for the week ending October 4 are expected to jump to 230,000 compared with 225,000 the prior week.
- US Consumer Price Index data for September:
- Near 13:15 GMT, Federal Reserve Governor Lisa Cook delivers a speech about entrepreneurship and innovation at the Women for Women Summit organized by the College of Charleston School of Business in Charleston, South Carolina. Cook is considered rather dovish in terms of policy stance.
- At 15:00 GMT, Federal Reserve Bank of New York President John Williams delivers keynote remarks at an event organized by Binghamton University in New York. Williams is considered neutral in terms of policy stance.
- There is some geographical dislocation in the equity markets, with Asia closing the day in a positive mode, even for Chinese indices. European equities look sluggish and are in the red, while US equity futures are subdued.
- The CME Fedwatch Tool shows an 80.1% chance of a 25 bps interest rate cut at the next Fed meeting on November 7, while 19.9% is pricing in no rate cut. Chances for a 50 bps rate cut have been fully priced out now.
- The US 10-year benchmark rate trades at 4.08%, the highest level since early August.
US Dollar Index Technical Analysis: King Dollar making its way
The US Dollar Index (DXY) knows no limits and rallies higher again on Thursday ahead of the US CPI release. With the US rates rallying, it should become clear that markets are starting to put less faith in the Fed being in a rate-cut cycle. The elevated levels and probabilities of no more bigger rate cuts this year could mean a rallying Greenback going into the US elections.
The psychological 103.00 is the first level to tackle on the upside. Further up, the chart identifies 103.18 as the very final resistance level for this week. Once above there, a very choppy area emerges, with the 100-day Simple Moving Average (SMA) at 103.28, the 200-day SMA at 103.77, and the pivotal 103.99-104.00 levels in play.
On the downside, the 55-day SMA at 101.94 is the first line of defence, backed by the 102.00 round level and the pivotal 101.90 as support to catch any bearish pressure and trigger a bounce. If that level does not work out, 100.62 also acts as support. Further down, a test of the year-to-date low of 100.16 should take place before more downside. Finally, and that means giving up the big 100.00 level, the July 14, 2023, low at 99.58 comes into play.
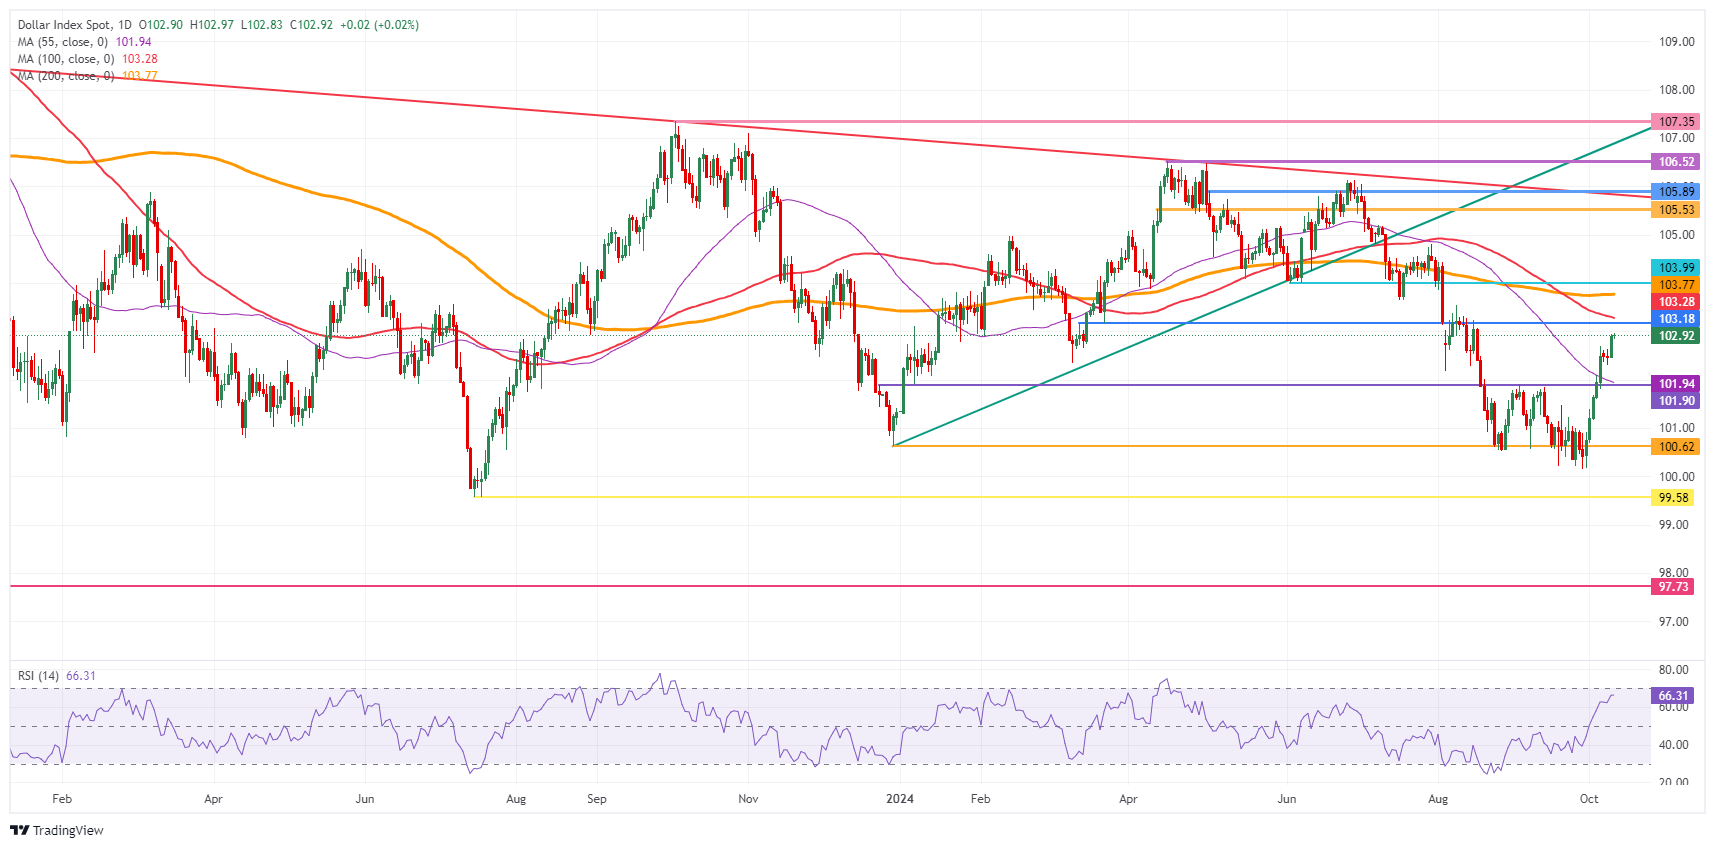
US Dollar Index: Daily Chart
US Dollar FAQs
The US Dollar (USD) is the official currency of the United States of America, and the ‘de facto’ currency of a significant number of other countries where it is found in circulation alongside local notes. It is the most heavily traded currency in the world, accounting for over 88% of all global foreign exchange turnover, or an average of $6.6 trillion in transactions per day, according to data from 2022. Following the second world war, the USD took over from the British Pound as the world’s reserve currency. For most of its history, the US Dollar was backed by Gold, until the Bretton Woods Agreement in 1971 when the Gold Standard went away.
The most important single factor impacting on the value of the US Dollar is monetary policy, which is shaped by the Federal Reserve (Fed). The Fed has two mandates: to achieve price stability (control inflation) and foster full employment. Its primary tool to achieve these two goals is by adjusting interest rates. When prices are rising too quickly and inflation is above the Fed’s 2% target, the Fed will raise rates, which helps the USD value. When inflation falls below 2% or the Unemployment Rate is too high, the Fed may lower interest rates, which weighs on the Greenback.
In extreme situations, the Federal Reserve can also print more Dollars and enact quantitative easing (QE). QE is the process by which the Fed substantially increases the flow of credit in a stuck financial system. It is a non-standard policy measure used when credit has dried up because banks will not lend to each other (out of the fear of counterparty default). It is a last resort when simply lowering interest rates is unlikely to achieve the necessary result. It was the Fed’s weapon of choice to combat the credit crunch that occurred during the Great Financial Crisis in 2008. It involves the Fed printing more Dollars and using them to buy US government bonds predominantly from financial institutions. QE usually leads to a weaker US Dollar.
Quantitative tightening (QT) is the reverse process whereby the Federal Reserve stops buying bonds from financial institutions and does not reinvest the principal from the bonds it holds maturing in new purchases. It is usually positive for the US Dollar.
추천 기사


