

Dow Jones Industrial Average churns ahead of red-band Fed rate call
- The Dow Jones is cycling near 41,500 as markets await the appearance of Powell.
- The Fed is set to begin a new rate cutting cycle on Wednesday.
- Markets are grappling with whether to expect a 50 or 25 bps cut.
The Dow Jones Industrial Average (DJIA) has pulled into Wednesday’s midrange near 41,500 as investors await the Federal Reserve's (Fed) first rate cut in over four years. Markets kicked off 2024 hoping for an initial rate cut in March, but have thus far been battled all the way back to Q3. Now it finally looks like the Fed is ready to play ball.
Read more: Federal Reserve set to cut interest rates in pivotal meeting for markets
Talking points from Fed officials, including Fed Chair Jerome Powell, pivoted toward finally delivering a rate cut within the past month, delivering hope to markets that have been leaning into expectations of rate moves for most of the year. The Fed is now widely expected to kick off a new rate-cutting cycle on Wednesday, and markets have already blown past the actual event to play tug-of-war with expectations of the depth of an initial cut, as well as the number of cuts expected to happen for the rest of the year.
According to the CME’s FedWatch Tool, rate markets are roughly on-balance with bets how deep the Fed’s first cut in four years will be. Rate traders have priced in 55% odds that the Fed will kick things off with a 50 bps cut right out of the gate, with the remaining 45% expecting a steadier 25 bps initial cut. The Fed drops their latest rate decision at around 2:00 pm EST/9:00 pm GMT.
Dow Jones news
The Dow Jones is roughly on-balance heading into the Fed’s rate call window, with about half of the index’s listed securities in the green in early Wednesday trading. Intel (INTC) is pulling back from a recent recovery, declining -2.3% and falling below $21 per share, while Apple (AAPL) is rebounding 2% to $221 per share. Apple is recovering after disappointing presales of their latest flagship iPhone disappointed investors, forcing the tech stock lower earlier this week.
Elsewhere in stocks, Honeywell (HON) is declining ahead of Wednesday’s Fed rate call, despite a recent announcement of a partnership with Samsung to produce carbon capture devices.
Dow Jones price forecast
Despite a tight pre-Fed pattern on Wednesday, the Dow Jones is still holding close to record highs set earlier this week. The DJIA could still make a break for higher ground above Tuesday’s record peak bid of 41,832.
However, near-term price action is playing out at the top end of a recent four-day bull run that dragged the Dow Jones up nearly 4.5% bottom-to-top. An exhaustion play on Fed expectations could see the major equity index rotate back into the low side and dip back toward the 50-day Exponential Moving Average (EMA) near 40,538.
Dow Jones daily chart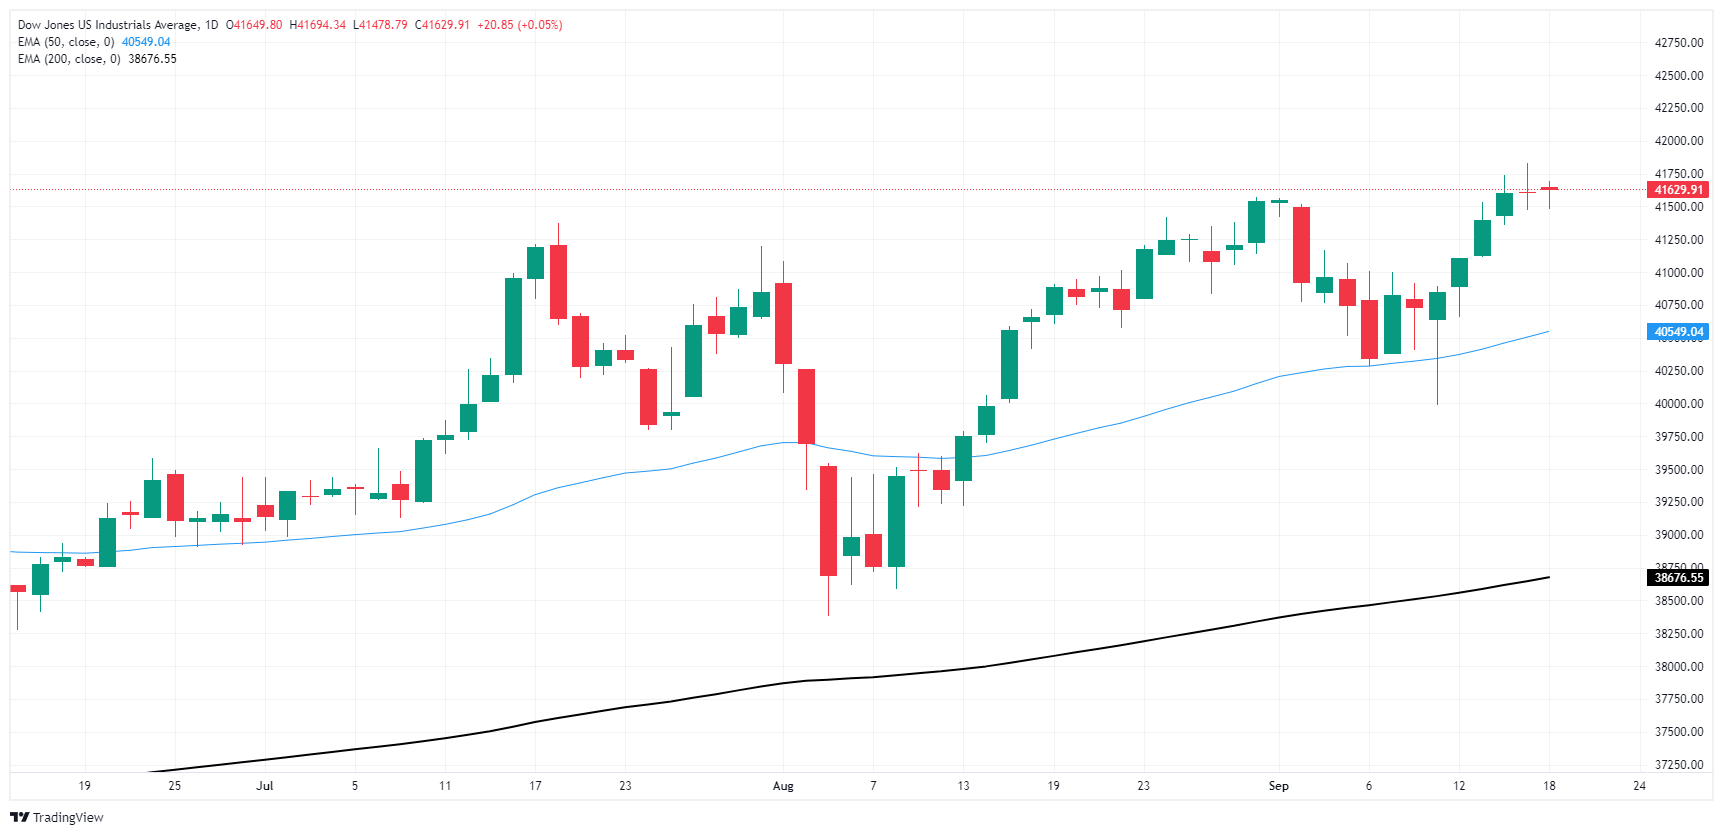
Dow Jones FAQs
The Dow Jones Industrial Average, one of the oldest stock market indices in the world, is compiled of the 30 most traded stocks in the US. The index is price-weighted rather than weighted by capitalization. It is calculated by summing the prices of the constituent stocks and dividing them by a factor, currently 0.152. The index was founded by Charles Dow, who also founded the Wall Street Journal. In later years it has been criticized for not being broadly representative enough because it only tracks 30 conglomerates, unlike broader indices such as the S&P 500.
Many different factors drive the Dow Jones Industrial Average (DJIA). The aggregate performance of the component companies revealed in quarterly company earnings reports is the main one. US and global macroeconomic data also contributes as it impacts on investor sentiment. The level of interest rates, set by the Federal Reserve (Fed), also influences the DJIA as it affects the cost of credit, on which many corporations are heavily reliant. Therefore, inflation can be a major driver as well as other metrics which impact the Fed decisions.
Dow Theory is a method for identifying the primary trend of the stock market developed by Charles Dow. A key step is to compare the direction of the Dow Jones Industrial Average (DJIA) and the Dow Jones Transportation Average (DJTA) and only follow trends where both are moving in the same direction. Volume is a confirmatory criteria. The theory uses elements of peak and trough analysis. Dow’s theory posits three trend phases: accumulation, when smart money starts buying or selling; public participation, when the wider public joins in; and distribution, when the smart money exits.
There are a number of ways to trade the DJIA. One is to use ETFs which allow investors to trade the DJIA as a single security, rather than having to buy shares in all 30 constituent companies. A leading example is the SPDR Dow Jones Industrial Average ETF (DIA). DJIA futures contracts enable traders to speculate on the future value of the index and Options provide the right, but not the obligation, to buy or sell the index at a predetermined price in the future. Mutual funds enable investors to buy a share of a diversified portfolio of DJIA stocks thus providing exposure to the overall index.
추천 기사


