
Ripple Price Forecast: XRP eyes $2.00 breakout as ETF inflows rise
- XRP rebounds as bulls target a short-term breakout above $2.00 on Friday.
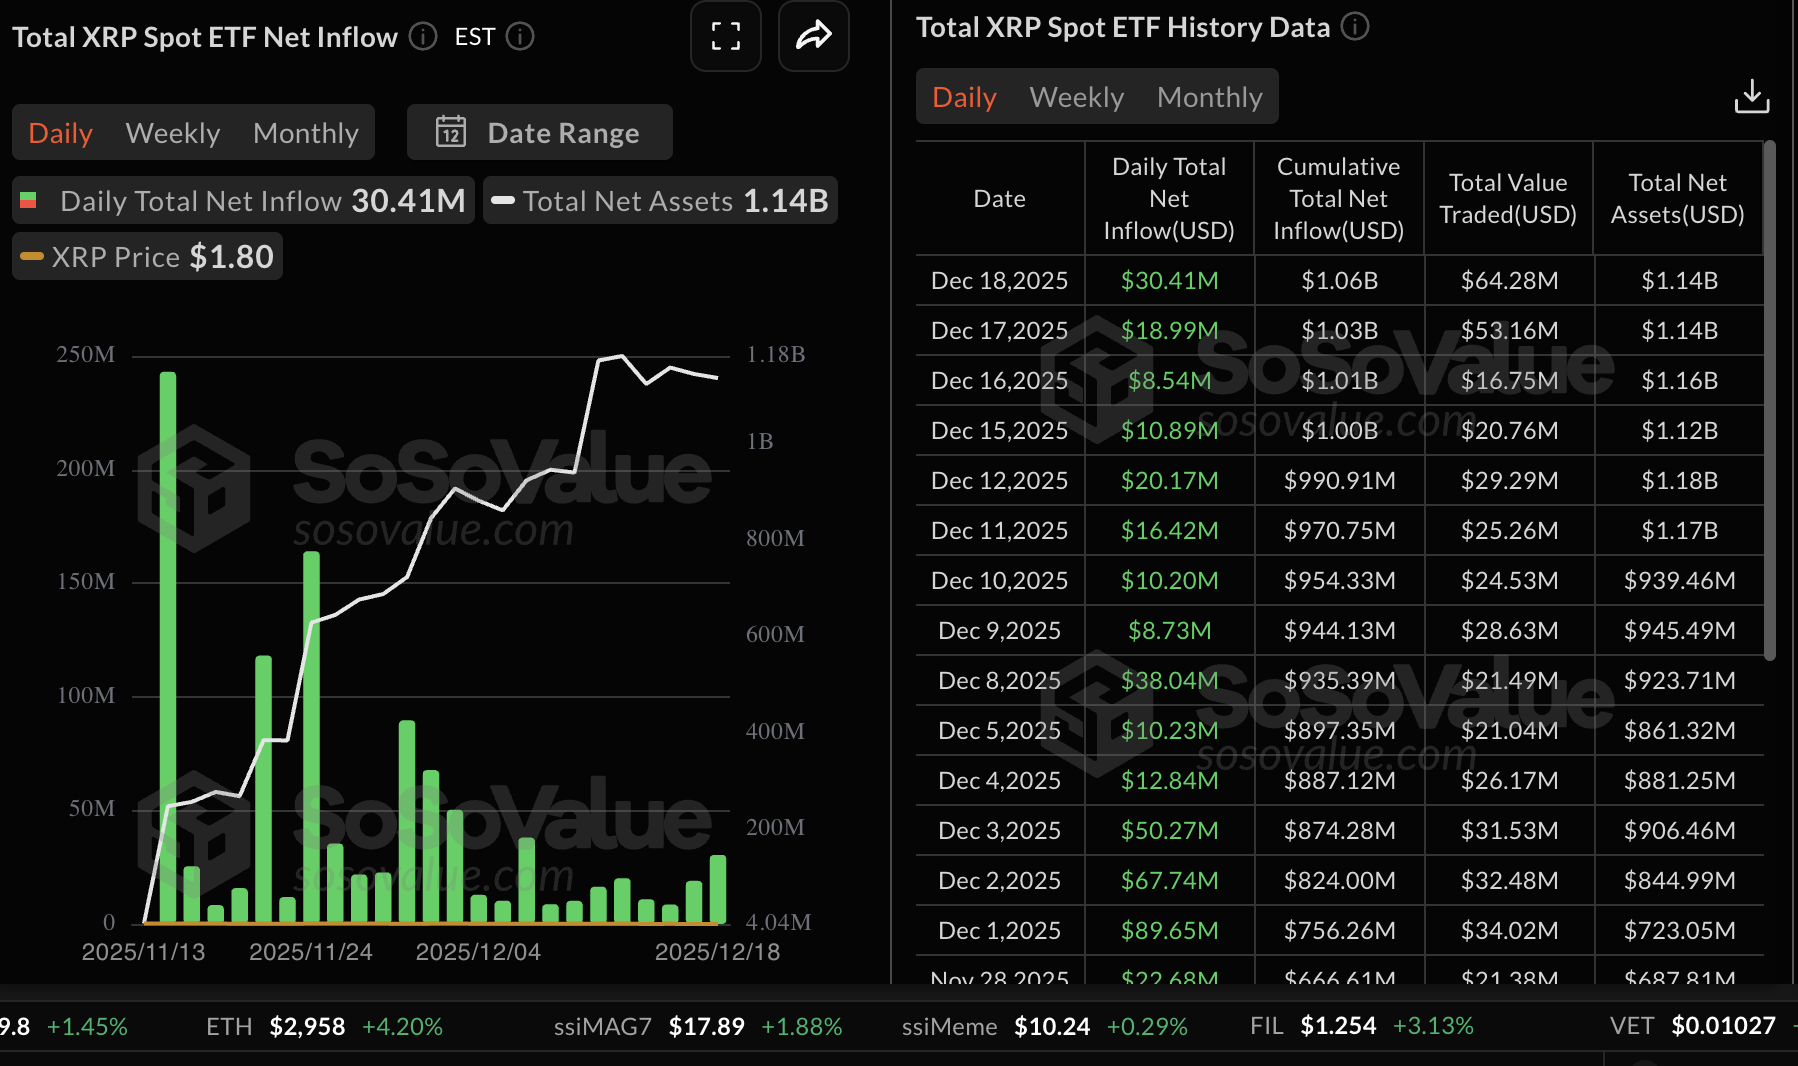
- XRP ETFs record the highest inflow since December 8, signaling growing institutional appetite.
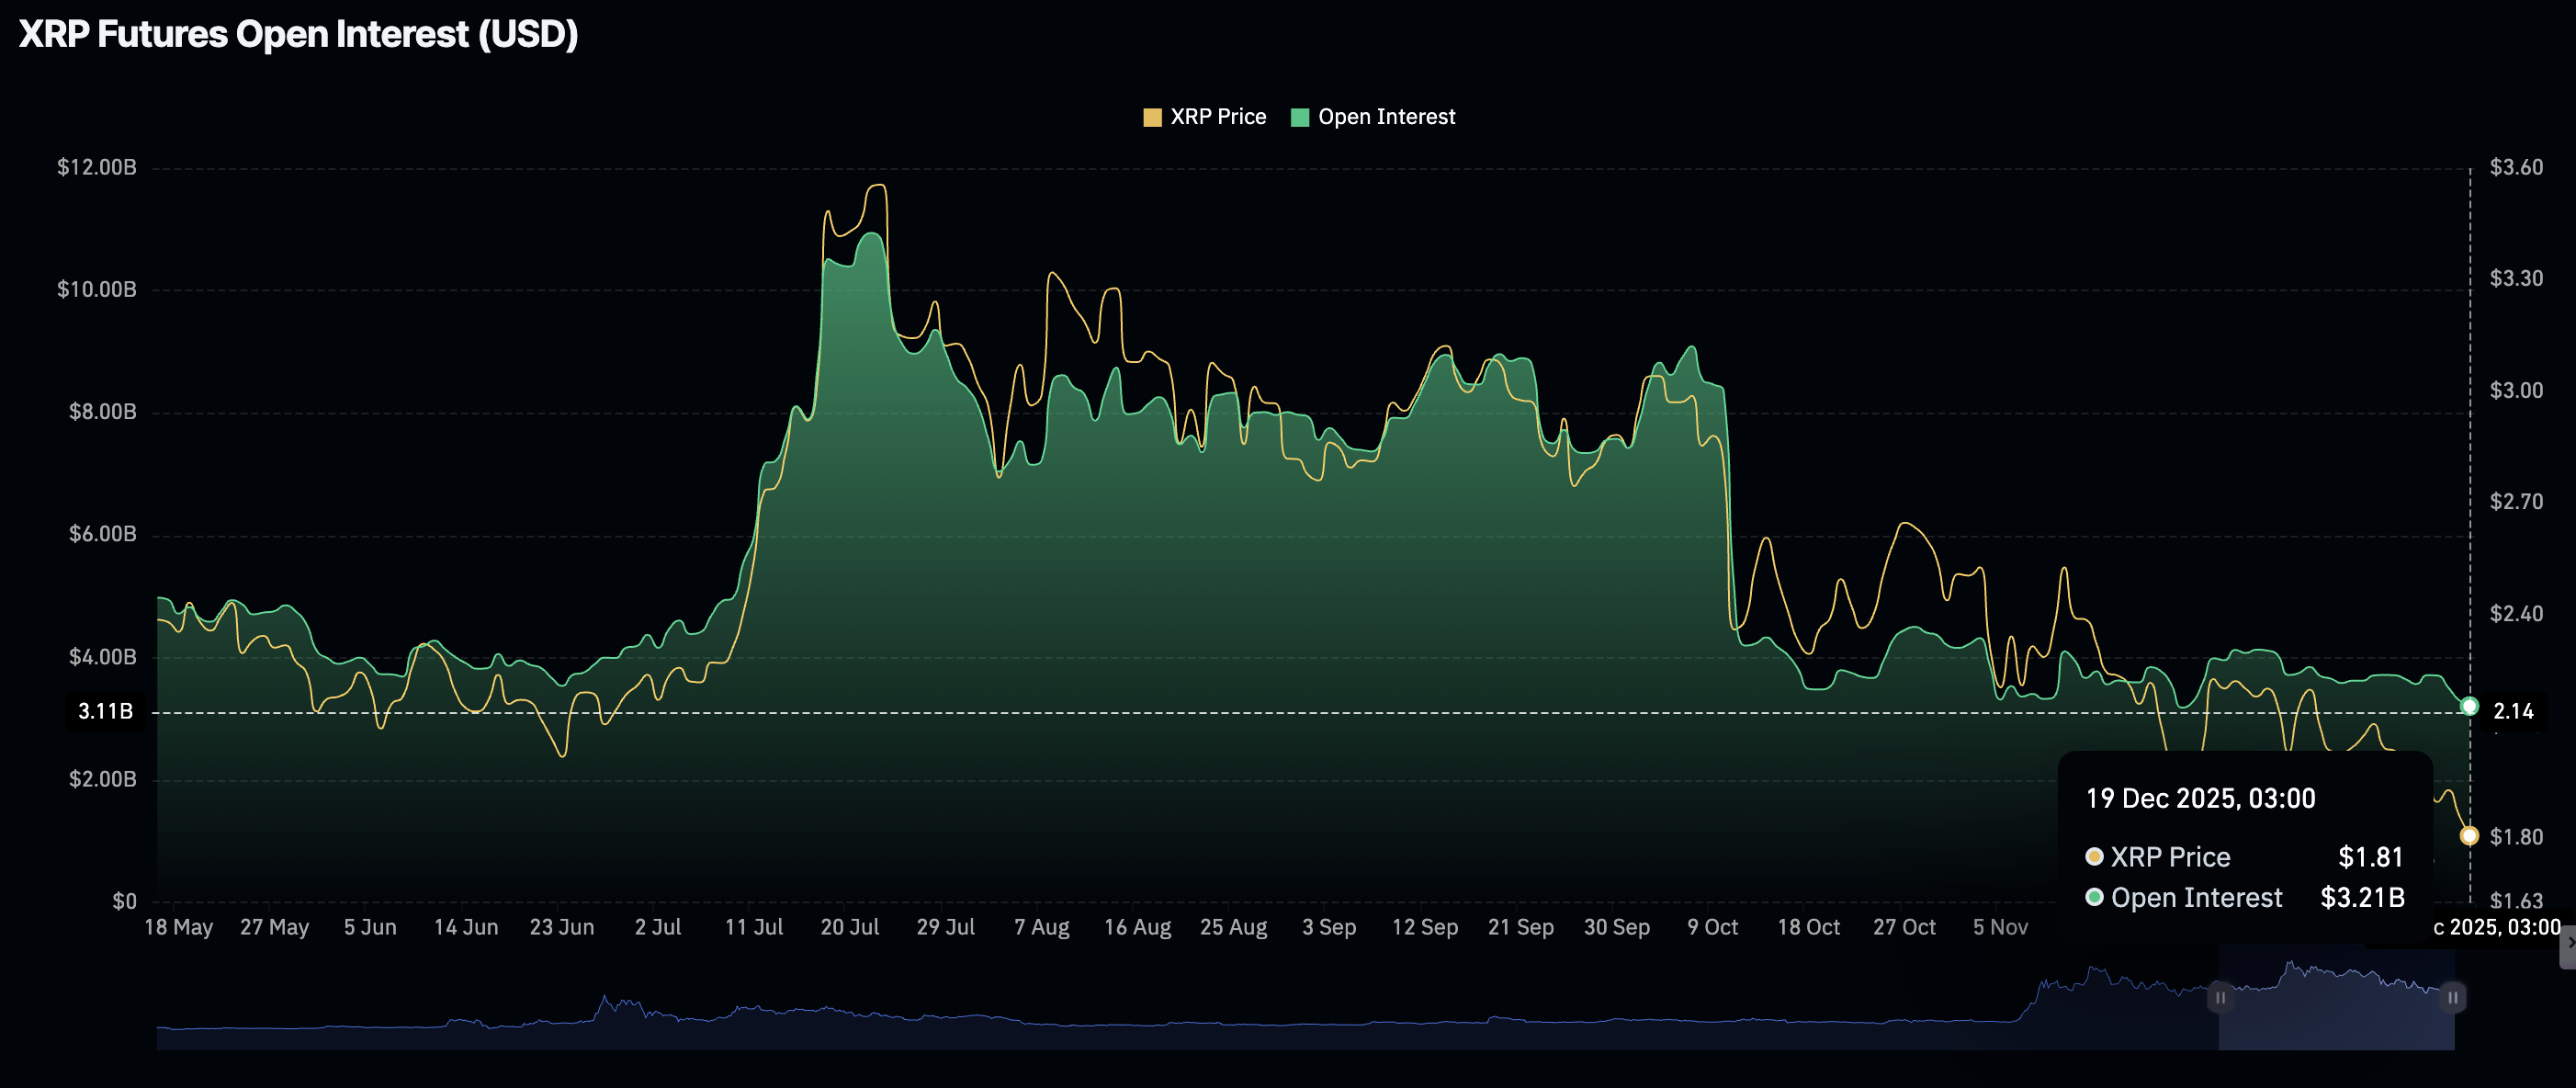
- Low retail demand, as reflected by futures Open Interest falling to $3.21 billion, could cap XRP price recovery.
Ripple (XRP) is up more than 3%, trading at $1.87 at the time of writing on Friday. XRP regains momentum, following whipsaw price action to an intraday low of $1.77, building on softer United States (US) Consumer Price Index (CPI) inflation, which increased by 2.7% annually in November, slower than analysts’ estimates of 3.1%.
A close above $2.00 will likely reinforce a short-term bullish outlook. However, key technical indicators still lean bearishly, which could cap rebounds.
XRP ETFs extend inflow streak
XRP spot Exchange Traded Funds (ETFs) listed in the United States (US) recorded inflows of approximately $30 million on Thursday. Grayscale’s GXRP ETF led with inflows of $10 million, followed by 21Shares’ TOXR ETF with almost $10 million and Franklin Templeton’s ZXRP ETF with nearly $7 million.
The cumulative inflow stands at $1.06 billion while net assets average $1.14 billion, according to SoSoValue data. Since their November debut, XRP ETFs have not experienced outflows, suggesting that institutional risk appetite is growing.
Steady ETF inflows are likely to support positive market sentiment, increasing the odds that XRP will sustain an uptrend.
On the other side, XRP is facing a significant drop in retail interest, which is negatively affecting the derivatives market and, on a larger scale, triggering frequent sell-offs. CoinGlass data shows futures Open Interest (OI) at $3.21 billion on Friday, down from $3.31 billion the previous day and $3.52 billion on Wednesday.
Since the October 10 flash crash, the XRP derivatives market has remained significantly suppressed, with OI fluctuating between $3 billion and $4 billion. Before the deleveraging event, OI stood at $8.36 billion on October 10 and $10.94 billion on July 22, which emphasizes the prevailing low retail interest and demand.
A sustained uptick in the OI is required to support steady price increases. Otherwise, recovery could remain a pipe dream, as investors reduce their exposure or stay on the sidelines.
Technical outlook: XRP edges higher, but downside risks remain
XRP is trading at $1.87 at the time of writing on Friday, supported by an uptrending Relative Strength Index (RSI) at 37 on the daily chart. A steady increase toward the 50 midline would affirm a short-term bullish outlook and increase the odds of XRP breaking above the pivotal $2.00 resistance.
On the contrary, the Moving Average Convergence Divergence (MACD) indicator sits in the negative region on the same chart and has maintained a sell signal since Monday. Investors will likely reduce exposure if the blue MACD line remains below the red signal line.
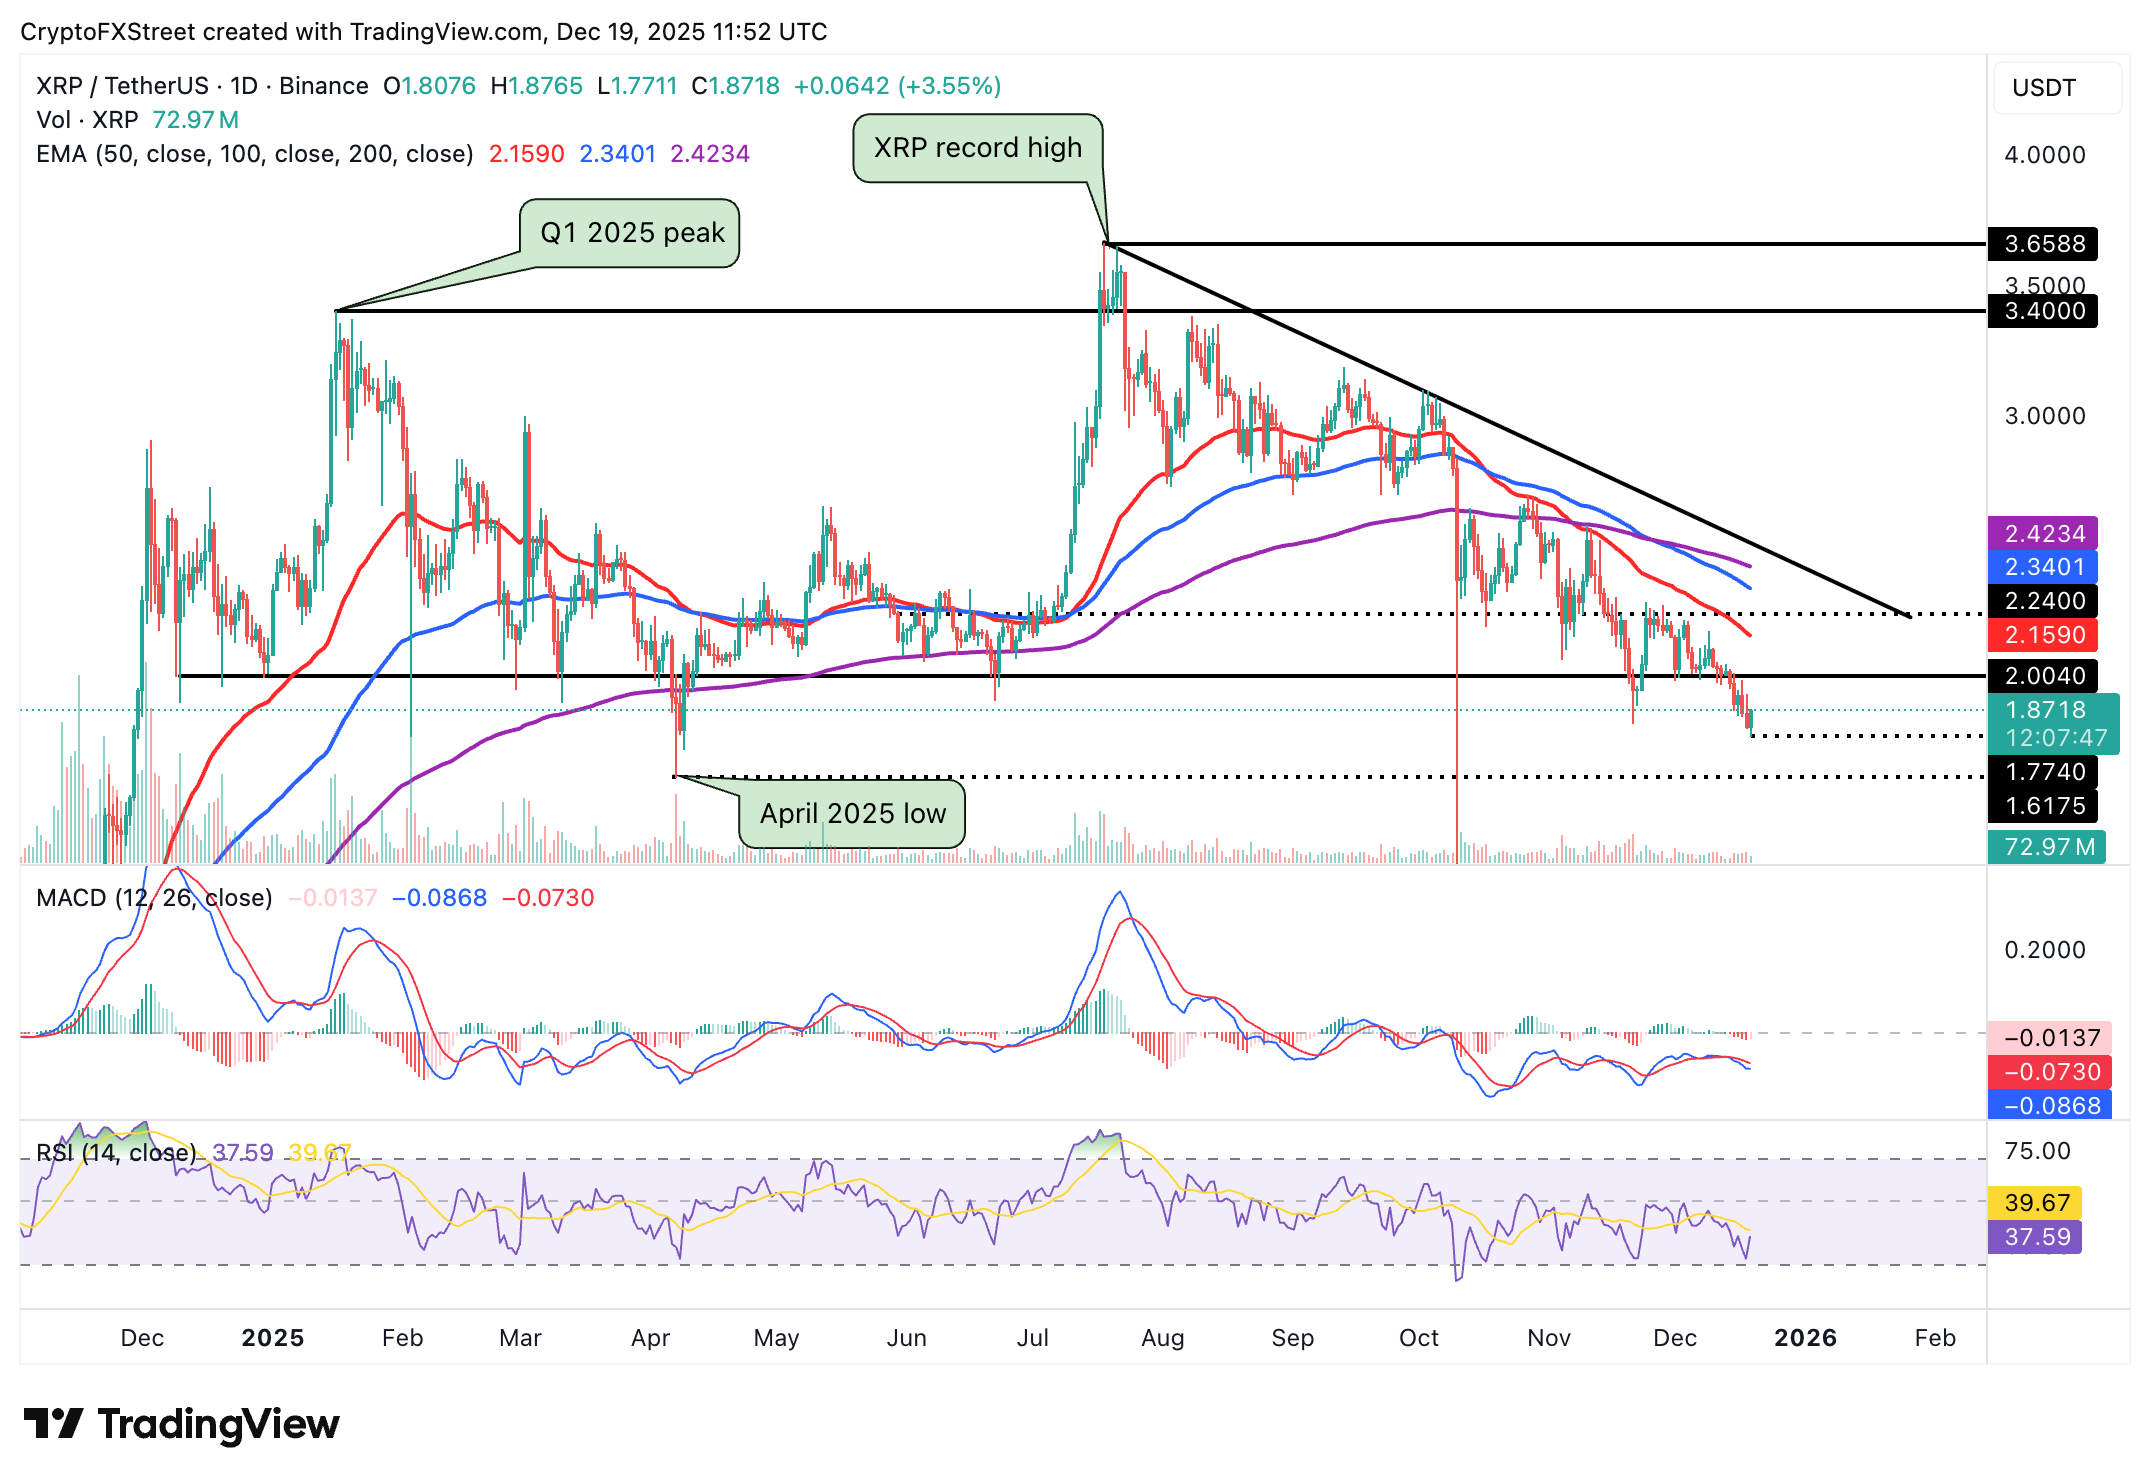
Meanwhile, the overall trend remains bearish, as evidenced by the 50-day Exponential Moving Average (EMA) at $2.15, the 100-day EMA at $2.34, and the 200-day EMA at $2.42, all sloping downward.
A close above the intraday low at $1.77 may steady the recovery toward $2.00.
Bulls must, however, flip the 50-day EMA at $2.15 to pave the way for gains above the 200-day EMA at $2.42. A further breakout above the descending trendline will likely mark a significant step toward XRP’s bullish outlook and a sustained uptrend, targeting $3.00.
Open Interest, funding rate FAQs
Higher Open Interest is associated with higher liquidity and new capital inflow to the market. This is considered the equivalent of increase in efficiency and the ongoing trend continues. When Open Interest decreases, it is considered a sign of liquidation in the market, investors are leaving and the overall demand for an asset is on a decline, fueling a bearish sentiment among investors.
Funding fees bridge the difference between spot prices and prices of futures contracts of an asset by increasing liquidation risks faced by traders. A consistently high and positive funding rate implies there is a bullish sentiment among market participants and there is an expectation of a price hike. A consistently negative funding rate for an asset implies a bearish sentiment, indicating that traders expect the cryptocurrency’s price to fall and a bearish trend reversal is likely to occur.
추천 기사


