

Crude Oil volatility settles down ahead of API stockpile data
- Oil prices trade in tight ranges as traders head into the Christmas holidays.
- Markets are not taking any stance despite some headlines about further stimulus in China, one of the top global consumers.
- The US Dollar Index trades just shy of a two-year high as volatility winds down.
Crude Oil prices are starting to see volatility die down on Tuesday as traders look ahead to Christmas Eve rather than the release of the American Petroleum Institute (API). Even headlines of further stimulus in China are not driving Oil prices higher: Chinese policymakers want to boost the economy with a 3 trillion Yuan bond injection, a move that should ramp up spending and result in a boost in demand for Oil from one of the world’s top consumers.
The US Dollar Index (DXY) – which measures the performance of the US Dollar (USD) against a basket of currencies – is residing just below the two-year high. The Greenback sees volatility die down in these final trading hours before Christmas. With its current position, a fresh two-year high could still be hit before the end of the year.
At the time of writing, Crude Oil (WTI) trades at $69.63 and Brent Crude at $72.84.
Oil news and market movers: Not making big waves
- Policymakers in China are planning to sell a record 3 trillion Yuan ($411 billion) of special treasury bonds in 2025. The government seeks to support consumption subsidies, business equipment upgrades as well as investments in key technology and advanced manufacturing sectors, according to Reuters.
- India’s state Oil refiners are finding it hard to buy the volume of Russian crude they need, people familiar with the matter told Bloomberg.
- Methane emissions in the US Permian Oil basin plunged 26% last year as companies tightened operations and deployed new technology to stop leaks of the potent greenhouse gas, according to a study by S&P Global Commodity Insights.
- At 21:30 GMT, the American Petroleum Institute (API) will release its weekly Crude Stockpile Change number. The previous week was a drawdown of 4.7 million barrels.
Oil Technical Analysis: Mild action
Crude Oil prices aren’t jumping significantly despite headlines that China is set to boost its local demand with a massive 3 trillion Yuan (CNH) injection. This should be beneficial for the local Oil demand as China is one of the world's biggest consumers. The fact that the stimulus plan still needs to be outlined further and that several market participants are not trading on Tuesday makes a big move in Oil prices very unlikely.
Looking up, the 100-day Simple Moving Average (SMA) at $70.76 and $71.46 (February 5 low) act as firm resistance levels nearby. Should more tailwinds emerge in support for Oil, the next pivotal level will be $75.27 (January 12 high). However, watch out for quick profit-taking as the year-end quickly approaches.
On the downside, $67.12 – a level that held the price in May and June 2023 and during the last quarter of 2024 – is still the first solid support nearby. In case that breaks, the 2024 year-to-date low emerges at $64.75, followed by $64.38, the low from 2023.
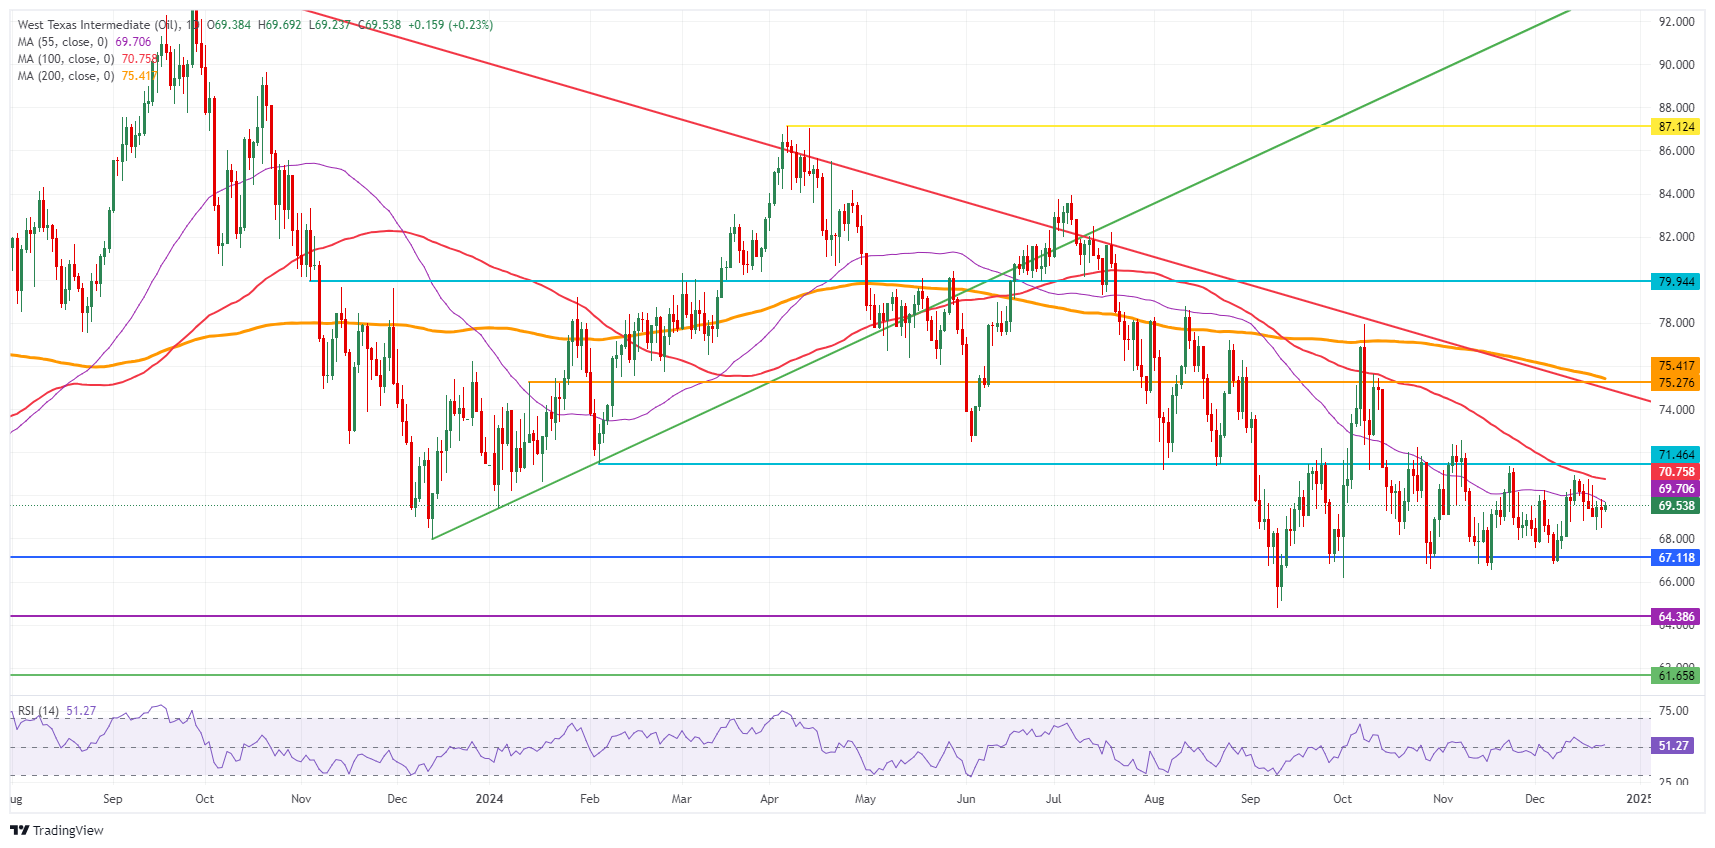
US WTI Crude Oil: Daily Chart
WTI Oil FAQs
WTI Oil is a type of Crude Oil sold on international markets. The WTI stands for West Texas Intermediate, one of three major types including Brent and Dubai Crude. WTI is also referred to as “light” and “sweet” because of its relatively low gravity and sulfur content respectively. It is considered a high quality Oil that is easily refined. It is sourced in the United States and distributed via the Cushing hub, which is considered “The Pipeline Crossroads of the World”. It is a benchmark for the Oil market and WTI price is frequently quoted in the media.
Like all assets, supply and demand are the key drivers of WTI Oil price. As such, global growth can be a driver of increased demand and vice versa for weak global growth. Political instability, wars, and sanctions can disrupt supply and impact prices. The decisions of OPEC, a group of major Oil-producing countries, is another key driver of price. The value of the US Dollar influences the price of WTI Crude Oil, since Oil is predominantly traded in US Dollars, thus a weaker US Dollar can make Oil more affordable and vice versa.
The weekly Oil inventory reports published by the American Petroleum Institute (API) and the Energy Information Agency (EIA) impact the price of WTI Oil. Changes in inventories reflect fluctuating supply and demand. If the data shows a drop in inventories it can indicate increased demand, pushing up Oil price. Higher inventories can reflect increased supply, pushing down prices. API’s report is published every Tuesday and EIA’s the day after. Their results are usually similar, falling within 1% of each other 75% of the time. The EIA data is considered more reliable, since it is a government agency.
OPEC (Organization of the Petroleum Exporting Countries) is a group of 12 Oil-producing nations who collectively decide production quotas for member countries at twice-yearly meetings. Their decisions often impact WTI Oil prices. When OPEC decides to lower quotas, it can tighten supply, pushing up Oil prices. When OPEC increases production, it has the opposite effect. OPEC+ refers to an expanded group that includes ten extra non-OPEC members, the most notable of which is Russia.
추천 기사


