

Gold price drops for sixth straight day as Fed Minutes hint at 25 bps cut
- Gold declined as Fed Minutes revealed a “substantial majority” backed a 50 bps cut, while some preferred 25 bps.
- CME FedWatch Tool shows lower odds of a 25 bps cut, down to 75.9%, with rising expectations for a rate pause.
- US 10-year Treasury yield rises to 4.062%, supporting the US Dollar.
- Traders await Thursday's CPI data for further direction on inflation and Fed policy.
Gold extended its losses for the sixth consecutive day after the Federal Reserve (Fed) revealed its September Meeting Minutes. The Minutes showed that the “substantial majority” of the Federal Open Market Committee (FOMC) backed a 50-basis-point (bps) cut. Despite this, the XAU/USD trades within familiar levels near $2,610, down over 0.37%.
The FOMC’s Minutes showed that some officials would’ve preferred a 25 bps cut, though all participants favored lowering interest rates. Regarding the Fed’s dual mandate in both cases, almost all officials saw inflation risks tilted to the downside, while risks to the labor market were on the upside.
Following the data, the CME FedWatch Tool shows odds for a 25 bps interest rate cut were lowered from 85.2% a day ago to 75.9%. This means that some market participants positioned themselves toward the Fed holding rates unchanged, with odds at 24.1%, up from 14.8% on Tuesday.
US Treasury yields continued to rise with the US 10-year Treasury note at 4.062%, up five and a half bps. This underpinned the Greenback, which according to the US Dollar Index (DXY) is up 0.42% at 102.90, its highest level since mid-August 2024.
Now, traders' focus shifts to Thursday's release of the US Consumer Price Index (CPI). Estimates suggest that inflation will continue to aim lower. Nevertheless, if inflation comes in higher than estimates, it will open the door for a pause on the Fed’s easing cycle.
The US economic schedule for the week will feature US inflation, US jobs data and Fed speakers.
Daily digest market movers: Gold prices pressured by FOMC’s Minutes ahead of US CPI
- The US CPI is expected to decrease from 2.5% to 2.3% YoY. Monthly CPI is projected to come at 0.1%, down from 0.2%.
- Core CPI is foreseen to remain unchanged compared to August’s figure at 3.2% YoY. The September figure is estimated to dip from 0.3% to 0.2% MoM.
- Other data will reveal the Initial Jobless Claims for the week ending October 5. Projections suggest that 230K new people applied for unemployment benefits, above the prior reading of 225K.
- After Friday's NFP report, Fed officials are more cautious. Vice-Chair Philip Jefferson said his approach is "meeting by meeting" and data-driven. Boston Fed President Susan Collins expects more rate cuts, also based on incoming data.
- Following the last US jobs report, recession fears faded. Therefore, most Wall Street banks like Citi, JPMorgan and Bank of America revised their November Fed call from a 50 to 25 bps rate cut.
- Meanwhile, the People’s Bank of China (PBoC) halted its Bullion purchases for the fifth month. China’s reserves were unchanged as they stood at 72.8 million troy ounces at the end of last month.
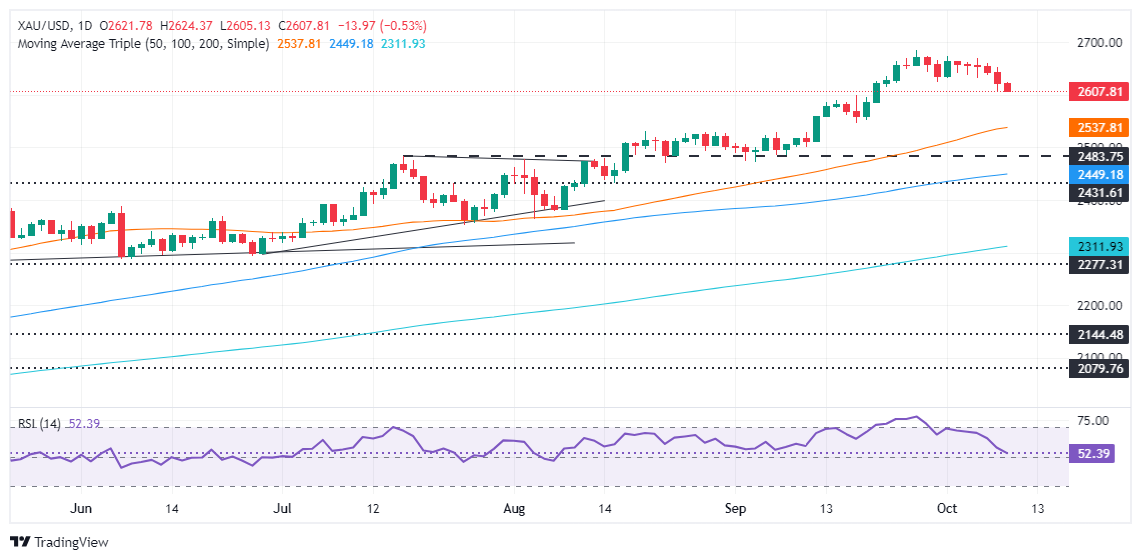
XAU/USD technical analysis: Gold price slips as sellers eye support underneath $2,650
Gold prices extended losses below $2,630 and dropped to a daily low of $2,605 as traders digested the FOMC’s September Meeting Minutes.
Short-term momentum is bearish even though the Relative Strength Index (RSI) shows mixed readings and stands in bullish territory.
XAU/USD has tumbled below $2,620. A breach of $2,600 will expose the psychological $2,550 mark ahead of the 50-day Simple Moving Average (SMA) at $2,537. Once these levels are surpassed, the $2,500 figure is up next.
Conversely, if Gold aims higher and reclaims $2,650, it will pave the way to challenge $2,670 ahead of the YTD high of $2,685.
Gold FAQs
Gold has played a key role in human’s history as it has been widely used as a store of value and medium of exchange. Currently, apart from its shine and usage for jewelry, the precious metal is widely seen as a safe-haven asset, meaning that it is considered a good investment during turbulent times. Gold is also widely seen as a hedge against inflation and against depreciating currencies as it doesn’t rely on any specific issuer or government.
Central banks are the biggest Gold holders. In their aim to support their currencies in turbulent times, central banks tend to diversify their reserves and buy Gold to improve the perceived strength of the economy and the currency. High Gold reserves can be a source of trust for a country’s solvency. Central banks added 1,136 tonnes of Gold worth around $70 billion to their reserves in 2022, according to data from the World Gold Council. This is the highest yearly purchase since records began. Central banks from emerging economies such as China, India and Turkey are quickly increasing their Gold reserves.
Gold has an inverse correlation with the US Dollar and US Treasuries, which are both major reserve and safe-haven assets. When the Dollar depreciates, Gold tends to rise, enabling investors and central banks to diversify their assets in turbulent times. Gold is also inversely correlated with risk assets. A rally in the stock market tends to weaken Gold price, while sell-offs in riskier markets tend to favor the precious metal.
The price can move due to a wide range of factors. Geopolitical instability or fears of a deep recession can quickly make Gold price escalate due to its safe-haven status. As a yield-less asset, Gold tends to rise with lower interest rates, while higher cost of money usually weighs down on the yellow metal. Still, most moves depend on how the US Dollar (USD) behaves as the asset is priced in dollars (XAU/USD). A strong Dollar tends to keep the price of Gold controlled, whereas a weaker Dollar is likely to push Gold prices up.
추천 기사


