

Silver Price Analysis: XAG/USD holds above $32.00 mark, seems poised to appreciate further
- Silver scales higher for the fourth straight day and climbs back closer to the weekly top.
- The technical setup favors bulls and supports prospects for a further appreciating move.
- Dips below the $32.00 mark could be seen as a buying opportunity and remain limited.
Silver (XAG/USD) attracts buyers for the fourth successive day on Friday and trades near the top end of its weekly range, above the $32.00 mark during the Asian session. Meanwhile, the white metal remains within the striking distance of a multi-year peak touched last week and seems poised to prolong its recent uptrend from the August monthly swing low.
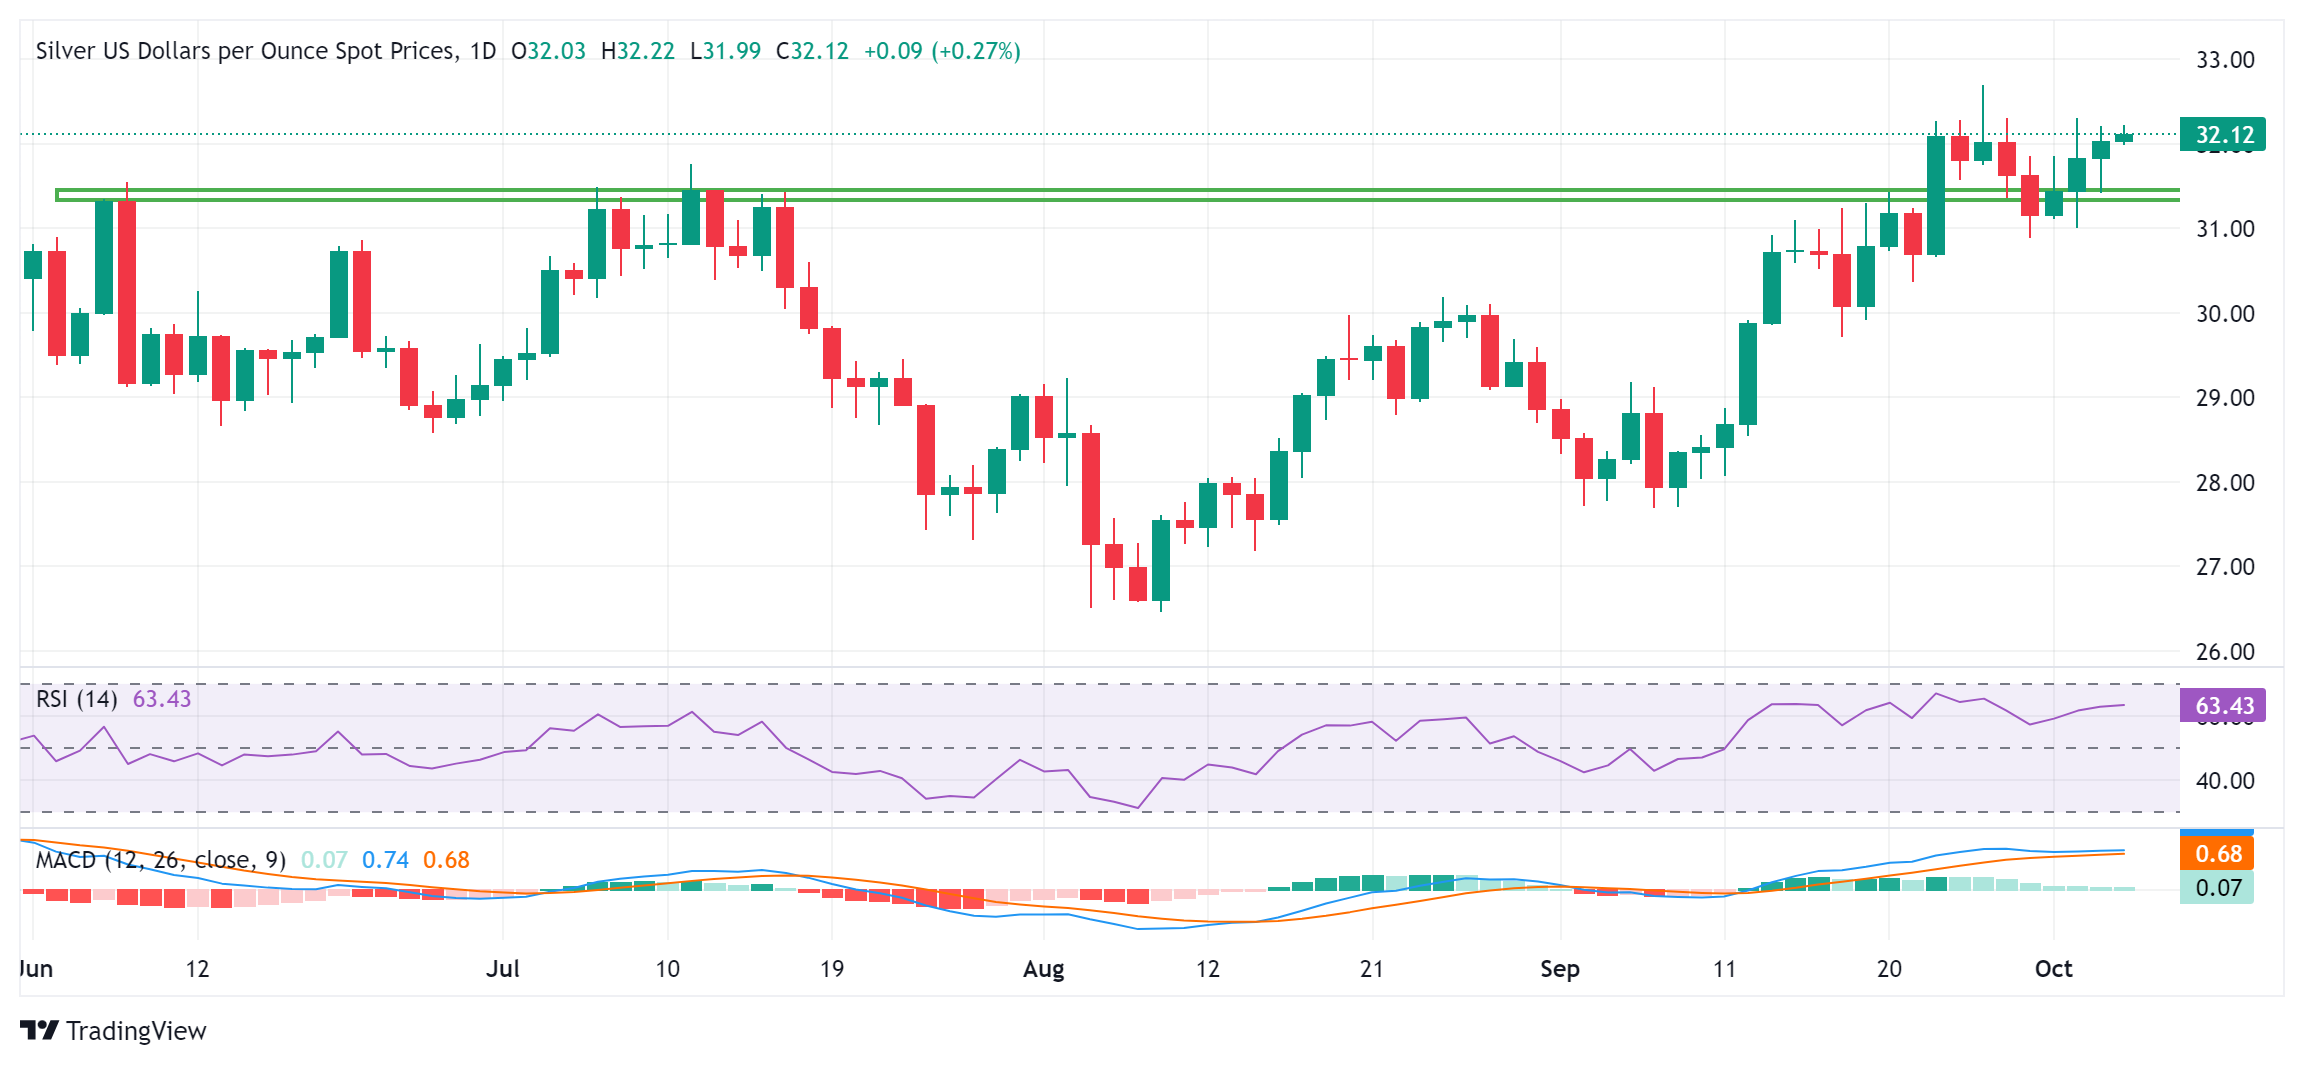
This week's bounce from sub-$31.00 levels and a subsequent move up validate the positive outlook. Moreover, oscillators on the daily chart are holding in positive territory and are away from being in the overbought zone, suggesting that the path of least resistance for the XAG/USD is to the upside. Hence, some follow-through strength back towards the multi-year top around the $32.70 region, en route to the $33.00 mark, looks like a distinct possibility.
On the flip side, weakness below the $32.00 mark now seems to find some support near the $31.75 area. A convincing break below, however, might prompt some technical selling and drag the XAG/USD towards the $31.10-$31.05 support and the weekly low, around the $30.90-$30.85 region. The latter should act as a key pivotal point, which if broken decisively will negate the constructive setup and shift the near-term bias in favor of bearish traders.
The XAG/USD might then accelerate the slide further towards the $30.25 zone before extending the downfall towards the $30.00 psychological mark and the 100-day SMA support near the $29.80-$29.65 region.
Silver daily chart
Silver FAQs
Silver is a precious metal highly traded among investors. It has been historically used as a store of value and a medium of exchange. Although less popular than Gold, traders may turn to Silver to diversify their investment portfolio, for its intrinsic value or as a potential hedge during high-inflation periods. Investors can buy physical Silver, in coins or in bars, or trade it through vehicles such as Exchange Traded Funds, which track its price on international markets.
Silver prices can move due to a wide range of factors. Geopolitical instability or fears of a deep recession can make Silver price escalate due to its safe-haven status, although to a lesser extent than Gold's. As a yieldless asset, Silver tends to rise with lower interest rates. Its moves also depend on how the US Dollar (USD) behaves as the asset is priced in dollars (XAG/USD). A strong Dollar tends to keep the price of Silver at bay, whereas a weaker Dollar is likely to propel prices up. Other factors such as investment demand, mining supply – Silver is much more abundant than Gold – and recycling rates can also affect prices.
Silver is widely used in industry, particularly in sectors such as electronics or solar energy, as it has one of the highest electric conductivity of all metals – more than Copper and Gold. A surge in demand can increase prices, while a decline tends to lower them. Dynamics in the US, Chinese and Indian economies can also contribute to price swings: for the US and particularly China, their big industrial sectors use Silver in various processes; in India, consumers’ demand for the precious metal for jewellery also plays a key role in setting prices.
Silver prices tend to follow Gold's moves. When Gold prices rise, Silver typically follows suit, as their status as safe-haven assets is similar. The Gold/Silver ratio, which shows the number of ounces of Silver needed to equal the value of one ounce of Gold, may help to determine the relative valuation between both metals. Some investors may consider a high ratio as an indicator that Silver is undervalued, or Gold is overvalued. On the contrary, a low ratio might suggest that Gold is undervalued relative to Silver.
추천 기사


