
Silver Price Forecast: XAG/USD nears $58.00 amid US Dollar weakness
- Silver approaches $58.00 after a neary 15% rally over the last six days.
- Fed cuts' hopes and a mild risk-aversion are boosting precious metals on Monday.
- Technically, the strongly overbought levels hint at a potential correction.
Silver (XAG/USD) rallies further on Monday and is on track for a 15% appreciation over the last six trading days, after reaching fresh record highs at $57.88. Market expectations that the Federal Reserve (Fed) will further ease monetary policy next week and a mild risk-averse mood are boosting precious metals.
US macroeconomic data released after the US government shutdown and dovish comments by Fed officials have boosted market expectations of a quarter-point rate cut after the November 10 meeting. Apart from that, rumours that the White House economic adviser, Kevin Hassett, will replace Jerome Powell as the next Fed Chairman are feeding expectations of more interest rate cuts next year.
Technical Analysis: Next resistances are at $58,00 and $60.00
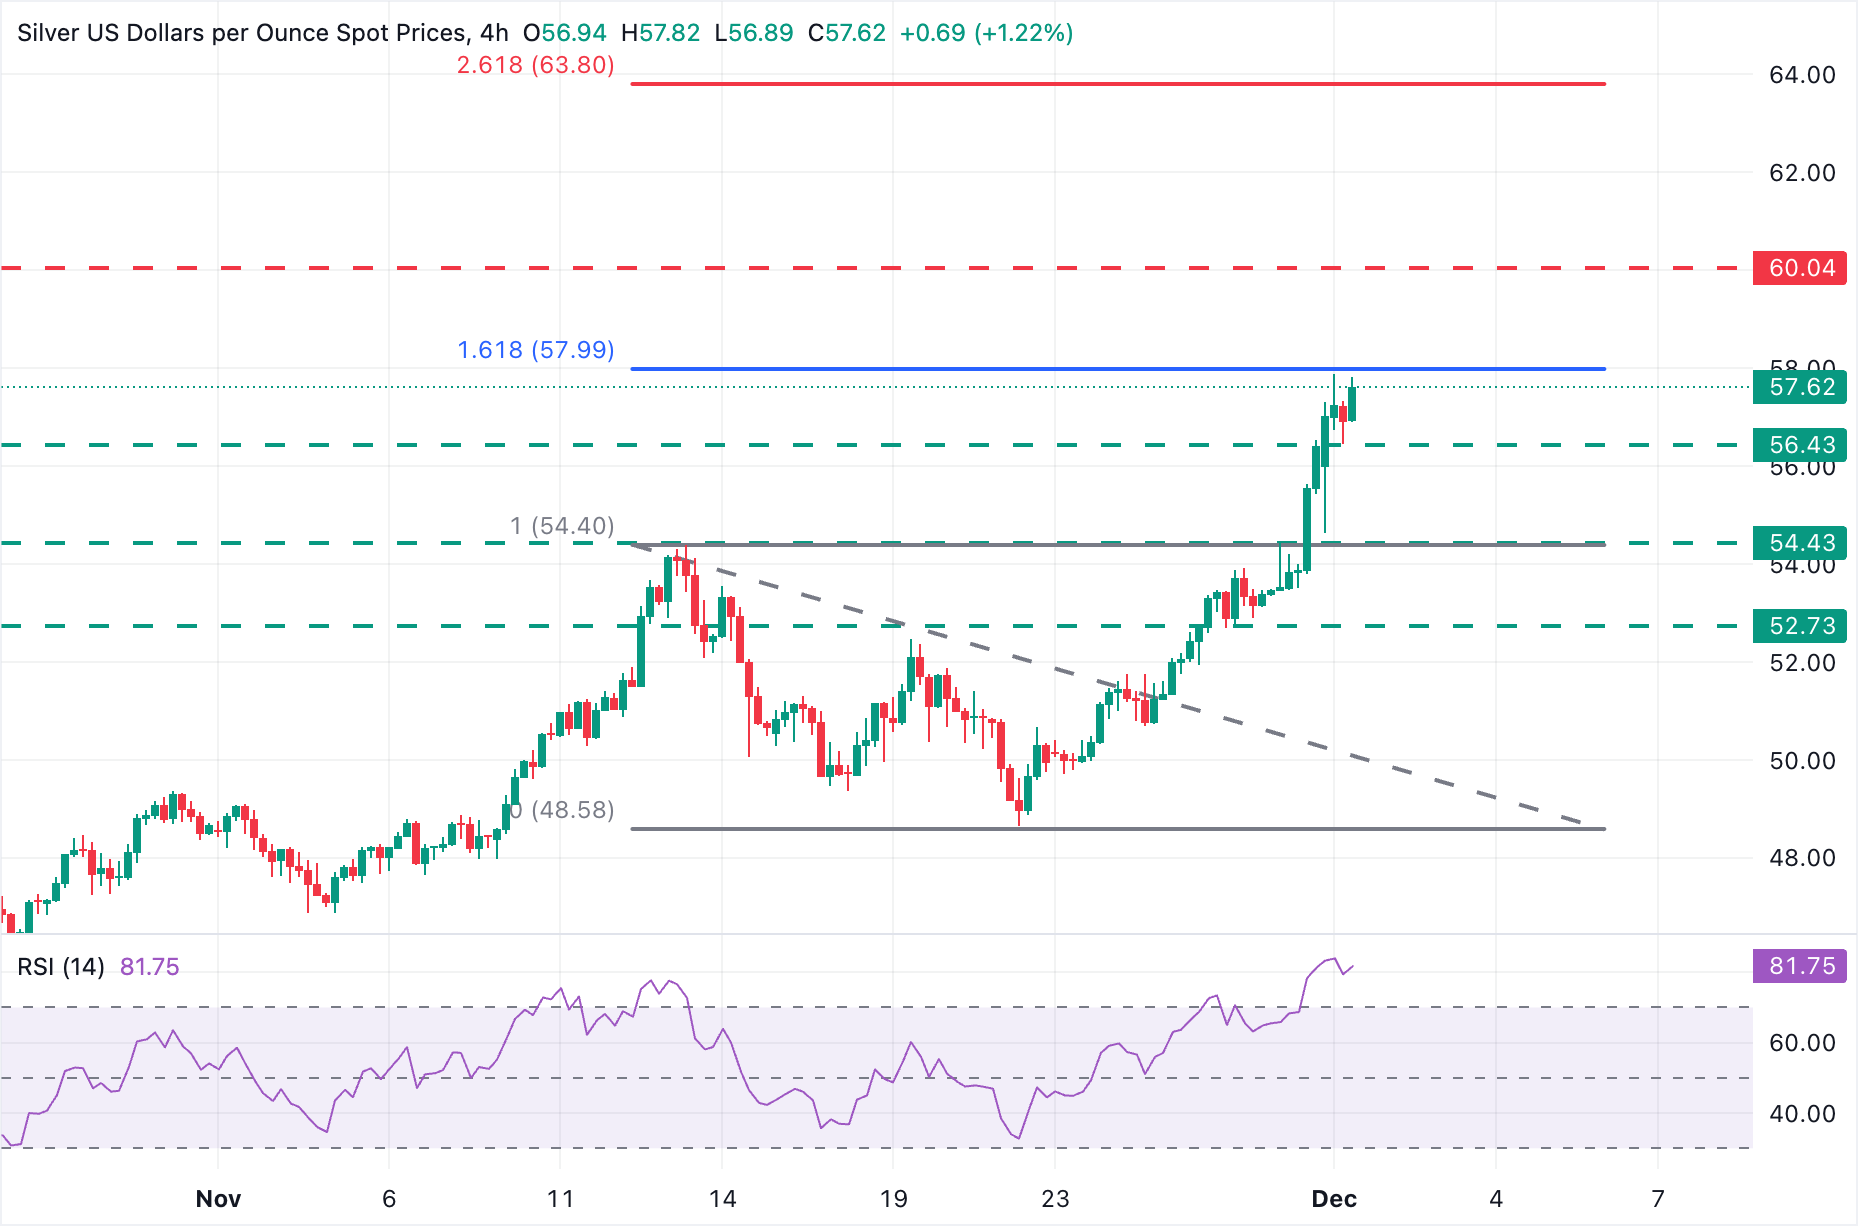
The technical picture remains positive, although the Relative Strength Index (RSI) has reached overbought levels at most timeframes, which should act as a warning for buyers. The 4-hour RSI is above 80.0, suggesting the possibility of a correction, but the fundamental background is underpinning speculative demand for precious metals.
Immediate resistance is at the 161.8% retracement of the mid-November pullback, around $58.00. Above here, the next upside target would be the $60.00 psychological level. The 261.8 Fibonacci retracement of the mentioned cycle is at $63.80.
On the downside, intraday support is at $56.45. A bearish reaction below that level might seek support at the previous record high, in the $54.45 area (November 13 high), ahead of the November 27 high, at $52.75.
Silver FAQs
Silver is a precious metal highly traded among investors. It has been historically used as a store of value and a medium of exchange. Although less popular than Gold, traders may turn to Silver to diversify their investment portfolio, for its intrinsic value or as a potential hedge during high-inflation periods. Investors can buy physical Silver, in coins or in bars, or trade it through vehicles such as Exchange Traded Funds, which track its price on international markets.
Silver prices can move due to a wide range of factors. Geopolitical instability or fears of a deep recession can make Silver price escalate due to its safe-haven status, although to a lesser extent than Gold's. As a yieldless asset, Silver tends to rise with lower interest rates. Its moves also depend on how the US Dollar (USD) behaves as the asset is priced in dollars (XAG/USD). A strong Dollar tends to keep the price of Silver at bay, whereas a weaker Dollar is likely to propel prices up. Other factors such as investment demand, mining supply – Silver is much more abundant than Gold – and recycling rates can also affect prices.
Silver is widely used in industry, particularly in sectors such as electronics or solar energy, as it has one of the highest electric conductivity of all metals – more than Copper and Gold. A surge in demand can increase prices, while a decline tends to lower them. Dynamics in the US, Chinese and Indian economies can also contribute to price swings: for the US and particularly China, their big industrial sectors use Silver in various processes; in India, consumers’ demand for the precious metal for jewellery also plays a key role in setting prices.
Silver prices tend to follow Gold's moves. When Gold prices rise, Silver typically follows suit, as their status as safe-haven assets is similar. The Gold/Silver ratio, which shows the number of ounces of Silver needed to equal the value of one ounce of Gold, may help to determine the relative valuation between both metals. Some investors may consider a high ratio as an indicator that Silver is undervalued, or Gold is overvalued. On the contrary, a low ratio might suggest that Gold is undervalued relative to Silver.
추천 기사


