


EUR/USD rallies further as the EU-US trade rift crushes the US Dollar
- EUR/USD extends gains for the second consecutive day and approaches 1.1700.
- Trump's latest tariff threat has triggered a "Sell America" trade.
- German Producer Price Index declined beyond expectations in December.
EUR/USD appreciates for the second consecutive day on Tuesday, reaching levels near 1.1700 at the time of writing, favoured by generalised US Dollar (USD) weakness. US President Donald Trump's threat of additional tariffs on European countries has triggered a "sell America" trade similar to the one that followed the "Liberation Day" in April.
A risk-averse sentiment prevails as Trump celebrates the first year of his second term, confirming his will to impose 10% additional tariffs on European countries opposing his plans to annex Greenland. The Eurozone leaders, in the meantime, are meeting in Brussels to discuss how to retaliate against Trump's threat amid an unprecedented trade war between Western allies.
In the Eurozone, German producer prices have shown further deflationary trends in December, as the focus now shifts to the German ZEW Economic Sentiment Index. The US markets are reopening after a long weekend on the Martin Luther King Jr. holiday. Still, the US economic calendar is practically empty, with the only release being the ADP weekly report on private-sector employment, and all eyes will be set on President Trump's speech at the Davos forum on Wednesday.
Euro Price Today
The table below shows the percentage change of Euro (EUR) against listed major currencies today. Euro was the strongest against the Japanese Yen.
| USD | EUR | GBP | JPY | CAD | AUD | NZD | CHF | |
|---|---|---|---|---|---|---|---|---|
| USD | -0.42% | -0.37% | 0.03% | -0.23% | -0.38% | -0.75% | -0.55% | |
| EUR | 0.42% | 0.05% | 0.44% | 0.19% | 0.04% | -0.34% | -0.13% | |
| GBP | 0.37% | -0.05% | 0.41% | 0.14% | -0.01% | -0.38% | -0.18% | |
| JPY | -0.03% | -0.44% | -0.41% | -0.25% | -0.41% | -0.78% | -0.57% | |
| CAD | 0.23% | -0.19% | -0.14% | 0.25% | -0.15% | -0.53% | -0.31% | |
| AUD | 0.38% | -0.04% | 0.01% | 0.41% | 0.15% | -0.37% | -0.15% | |
| NZD | 0.75% | 0.34% | 0.38% | 0.78% | 0.53% | 0.37% | 0.20% | |
| CHF | 0.55% | 0.13% | 0.18% | 0.57% | 0.31% | 0.15% | -0.20% |
The heat map shows percentage changes of major currencies against each other. The base currency is picked from the left column, while the quote currency is picked from the top row. For example, if you pick the Euro from the left column and move along the horizontal line to the US Dollar, the percentage change displayed in the box will represent EUR (base)/USD (quote).
Daily Digest Market Movers: Tariff threats hit the Dollar and boost the Euro, for now
- Trump's threat of additional tariffs on European countries has triggered a new round of the "Sell America" trade. Investors are selling the US Dollar and US Treasury yields in a de-dollarisation process as confidence in the US authorities fades. This has sent the Euro (EUR) up by nearly 1% against the US Dollar in two days.
- Data released by Destatis on Tuesday revealed that the German Producer Prices Index contracted 0.2% in December, beyond the -0.1% expected, following a flat reading in November. Year-on-year, producer prices fell at a 2.5% pace, from -2.3% in November and also beyond the -2.4% reading anticipated by the market consensus. The Euro has continued to appreciate after the data.
- Later on Tuesday, the German ZEW Survey is expected to show that institutional investors' sentiment about the economy continued to improve, reaching 50 in January, which would mark its best reading since July last year, from 45.8 in December and 38.5 in November.
- On Monday, the final Eurozone Harmonised Index of Consumer Prices (HICP) was revised down to 1.9% year-on-year growth in December, from previous estimates of a 2% reading. The core HICP, however, confirmed a 2.3% year-on-year growth. Monthly inflation was left unrevised at 0.2% and 0.3%, respectively.
Technical Analysis: EUR/USD is testing resistance at the 1.1700 area
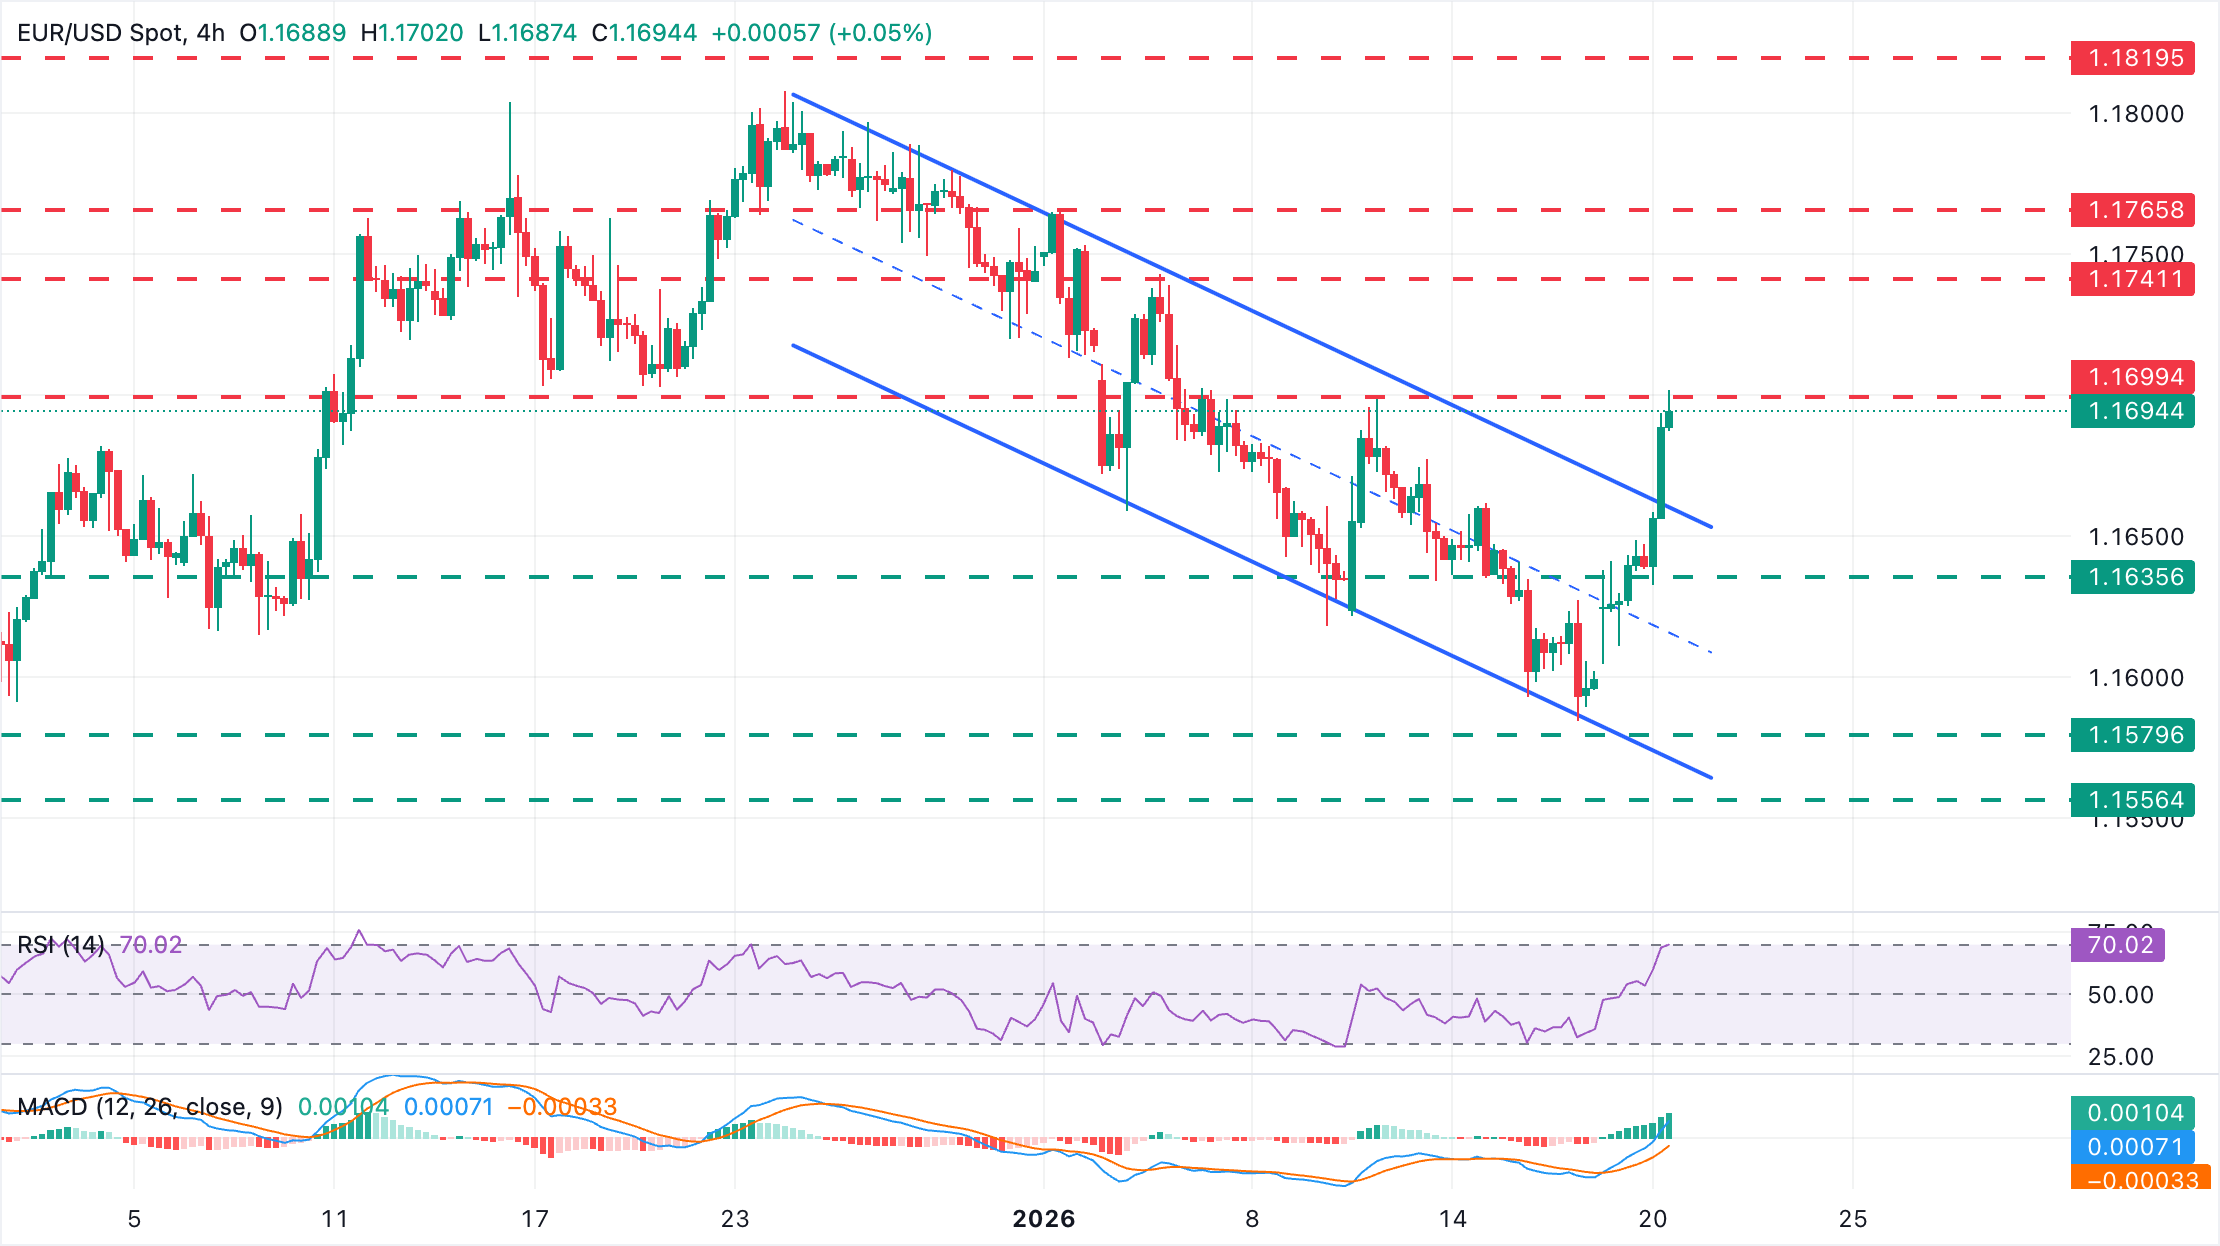
EUR/USD trades at 1.1695 at the time of writing, testing resistance at the 1.1700 area after breaking the top of the descending channel from late December highs.
Technical indicators on the 4-hour chart support the bullish view, as the Moving Average Convergence Divergence (MACD) turned positive, with its histogram expanding. The Relative Strength Index (RSI) is at levels consistent with a strong bullish momentum, although approaching the overbought area.
The pair is now testing resistance at the January 7 and 12 highs, in the 1.1700 psychological area. Further up, the next target is the January 6 high in the 1.1740 area. A bearish reversal might find support at the reverse trendline, now at the 1.1660 area ahead of the 1.1635 intra-day level.
(The technical analysis of this story was written with the help of an AI tool.)
Economic Indicator
Producer Price Index (YoY)
The Producer Price Index released by the Statistisches Bundesamt Deutschland measures the average changes in prices in the German primary markets. Changes in the PPI are widely followed as an indicator of commodity inflation. Generally speaking, a high reading is seen as positive (or bullish) for the EUR, whereas a low reading is seen as negative (or bearish).
Read more.Last release: Tue Jan 20, 2026 07:00
Frequency: Monthly
Actual: -2.5%
Consensus: -2.4%
Previous: -2.3%
Source: Federal Statistics Office of Germany
Economic Indicator
Producer Price Index (MoM)
The Producer Price Index released by the Statistisches Bundesamt Deutschland measures the average changes in prices in the German primary markets. Changes in the PPI are widely followed as an indicator of commodity inflation. Generally speaking, a high reading is seen as positive (or bullish) for the EUR, whereas a low reading is seen as negative (or bearish).
Read more.Last release: Tue Jan 20, 2026 07:00
Frequency: Monthly
Actual: -0.2%
Consensus: -0.1%
Previous: 0%
Source: Federal Statistics Office of Germany
추천 기사


