3 Things Investors Should Know About BlackRock’s Q4 2024 Earnings

Mitrade
coverImg
Source: DepositPhotos

TradingKey - It’s been a massive two years or so for the US stock market as both 2023 and 2024 saw the S&P 500 Index post gains in excess of 20%.


Besides the obvious winners, like Big Tech stocks, one of the sectors that has done extremely well in the rally has been financials. And that’s not been confined to the banks, either.


One of the biggest winners has been one of the world’s largest asset management firms, BlackRock Inc (NYSE: BLK). Its shares are up over 42% in the past two years. The company reported its latest Q4 2024 earnings on Wednesday (15 January) before the market opened in the US.


Here are three things investors should know about BlackRock’s latest financial results.


  1. AUM hits record high of US$11.5 trillion

For any large asset manager, the amount of money they manage is a key barometer of how much appeal they hold with investors. 

This amount – known as “assets under management” or AUM – hit a record high of US$11.55 trillion during the quarter for BlackRock. That figure was up from US$10 trillion in the year-ago period.


Client assets were turbocharged by a fourth-quarter rally in the US following Donald Trump’s presidential election victory. Net inflows in the fourth quarter alone amounted to US$281 billion and this contributed to a full-year 2024 record of US$641 billion in net inflows. 

The firm’s launch of its massive Bitcoin ETF – the iShares Bitcoin Trust ETF (NASDAQ: IBIT) that is now the world’s largest Bitcoin ETF by AUM – also contributed to the general trend of investors putting money into BlackRock products.


In 2024, BlackRock had also expanded more into the private markets space by splurging around US$25 billion on two acquisitions – buying infrastructure fund Global Infrastructure Partners and private credit firm HPS Investment Partners. BlackRock’s pending deal to acquire private markets data provider – Preqin – should also strengthen its position in the private markets space.

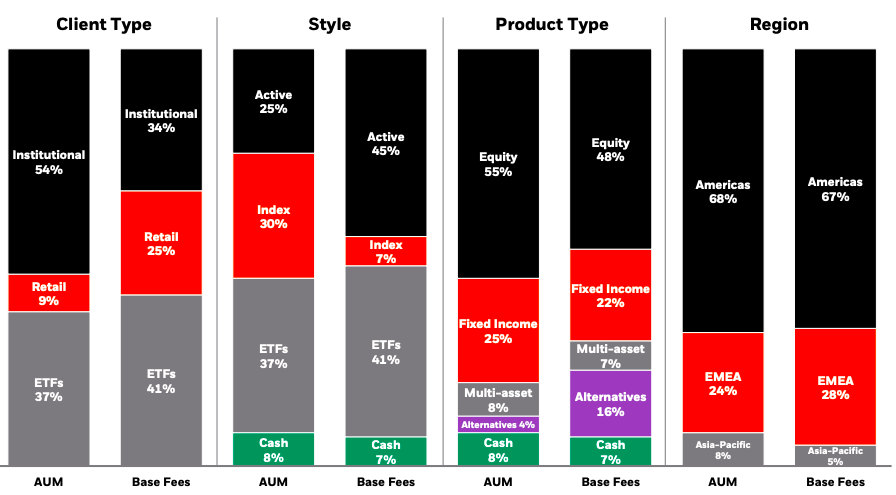
With these two additions, BlackRock is likely to see its share of both AUM and base fees in “Alternatives” grow in the years ahead.


BlackRock’s AUM and base fees by client type, style, product type, and region, Q4 2024
A graph of different types of income

Description automatically generated with medium confidence

Source: BlackRock’s Q4 2024 earnings presentation

  1. Operating income rises 21% for 2024

For Q4 2024, BlackRock’s net income rose to US$1.67 billion, from US$1.38 billion in Q4 2023. Meanwhile, the firm’s full-year 2024 diluted earnings per share (EPS) saw a 15% increase year-on-year and reflects the lower nonoperating income and a higher effective tax rate during the year.


For the full-year 2024, BlackRock also reported an impressive 21% year-on-year increase in operating income to US$7.57 billion. From the Q4 2024 perspective, BlackRock’s operating income growth was even better as it posted operating income of US$2.08 billion, up 31% year-on-year from the fourth quarter of 2023. 


  1. US$4.7 billion returned to shareholders in 2024

Finally, BlackRock – despite its strong growth in AUM – is also returning capital to shareholders via share buybacks and increased dividends.


BlackRock stated that it returned US$4.7 billion to shareholders in 2024, including US$1.6 billion in share repurchases. While its weighted-average diluted shares have recently spiked to 157 million shares – as of the end of Q4 2024 – versus the 149.6 million in Q3 2024, that was mainly down to the impact of a 6.9 million share issuance as part of the deal for Global Infrastructure Partners.


On the dividend front, investors will be pleased to know that BlackRock currently pays a dividend per share (DPS) of US$5.10 and is due to hike its dividend at some point in the next few months. At the moment, BlackRock shares are yielding 2%.


Solid quarter for asset management giant


It was another solid quarter for BlackRock in terms of both AUM growth, net inflows, and profitability. The market recognised that bullishness as BlackRock shares ended the day up 5.1%.


Over the past year, BlackRock shares have risen by 28% versus the 24.8% return from the S&P 500 Index over the same period.

Read more

  • Bitcoin Plunges 13% in a Week as Market Retreats to $60,000 Level
  • * The content presented above, whether from a third party or not, is considered as general advice only.  This article should not be construed as containing investment advice, investment recommendations, an offer of or solicitation for any transactions in financial instruments.

    goTop
    quote
    Related Articles
    placeholder
    Nvidia Q3 Earnings Loom as Market Expects Revenue Near $109 Billion: Can NVDA Stock Hold $150? As of the close on November 16 ET, Nvidia (NVDA) shares fell 4.12% to close at $156.14, with an intraday low of $155.01 and trading volume of about 334 million shares. Compared with its p
    Author  TradingKey
    1 hour ago
    As of the close on November 16 ET, Nvidia (NVDA) shares fell 4.12% to close at $156.14, with an intraday low of $155.01 and trading volume of about 334 million shares. Compared with its p
    placeholder
    Weekly Report: The index rose 2.5% while Nvidia fell 12.7% — two equity divergences, one should closeThe S&P 500 rose 2.51% to 7,561.67 and the QQQ rose 3.63% to 679.89 last week, while Nvidia fell 12.75% to 162.85 — a sixth straight weekly loss and 32% below its October record. In the same five sessions, energy equities rose 5.42% while WTI fell 2.52%. Both pairs normally move together (60-day correlations of +0.64 and +0.58). This report ranks which divergence closes first, with the trigger for each.
    Author  Irene Q.
    Yesterday 02: 35
    The S&P 500 rose 2.51% to 7,561.67 and the QQQ rose 3.63% to 679.89 last week, while Nvidia fell 12.75% to 162.85 — a sixth straight weekly loss and 32% below its October record. In the same five sessions, energy equities rose 5.42% while WTI fell 2.52%. Both pairs normally move together (60-day correlations of +0.64 and +0.58). This report ranks which divergence closes first, with the trigger for each.
    placeholder
    Anthropic is six times oversubscribed at $1.4 trillion while Nvidia is down 32% — the AI trade has two pricesAnthropic lists on Nasdaq as ANT on Thursday at $70 ~ $78 a share, raising up to $64.4 billion at a target valuation near $1.4 trillion, and the book is reportedly six times covered. In the same six weeks, Nvidia has fallen 32% and the QQQ is 10.9% below its October peak. Private capital and public markets are marking the same AI complex at two very different prices. This piece separates the two books: what the S-1 shows, who is anchoring the $26 billion private placement, and what Thursday's debut would have to do to change the public tape.
    Author  Irene Q.
    Yesterday 02: 27
    Anthropic lists on Nasdaq as ANT on Thursday at $70 ~ $78 a share, raising up to $64.4 billion at a target valuation near $1.4 trillion, and the book is reportedly six times covered. In the same six weeks, Nvidia has fallen 32% and the QQQ is 10.9% below its October peak. Private capital and public markets are marking the same AI complex at two very different prices. This piece separates the two books: what the S-1 shows, who is anchoring the $26 billion private placement, and what Thursday's debut would have to do to change the public tape.
    placeholder
    Nvidia reports tomorrow with an interim CEO — $108 billion is the easy numberNvidia closed at 162.85 on Friday, down 12.75% on the week and 32% below its 6 October record, with market value down to $3.92 trillion. The Q3 bar is $108 billion ±2%, and consensus already sits at $108.7 ~ 108.8 billion, so the revenue line is not where the surprise lives. The number that decides the reaction is the 71 ~ 72% Q4 gross-margin trough, followed by a Q4 guide against a $124.9 billion consensus. This piece prices the print, marks the 158.39 line and lays out the three scenarios in a table.
    Author  Irene Q.
    Yesterday 02: 11
    Nvidia closed at 162.85 on Friday, down 12.75% on the week and 32% below its 6 October record, with market value down to $3.92 trillion. The Q3 bar is $108 billion ±2%, and consensus already sits at $108.7 ~ 108.8 billion, so the revenue line is not where the surprise lives. The number that decides the reaction is the 71 ~ 72% Q4 gross-margin trough, followed by a Q4 guide against a $124.9 billion consensus. This piece prices the print, marks the 158.39 line and lays out the three scenarios in a table.
    placeholder
    Today’s Market Recap: Nvidia Drops Over 4% After Jensen Huang Resigns, AMD and Broadcom Both Rise Over 5% On November 12, the three major U.S. stock indices closed slightly lower. Nvidia announced that Jensen Huang had stepped down immediately as CEO and director, draggi
    Author  TradingKey
    Nov 13, Fri
    On November 12, the three major U.S. stock indices closed slightly lower. Nvidia announced that Jensen Huang had stepped down immediately as CEO and director, draggi
    Live Quotes
    Name / SymbolChart% Change / Price
    US500
    US500
    0.00%0.00

    US Stocks Related Articles

    • 10 Best Day Trading Platforms for Beginners and Active Traders in 2026: A Practical Guide
    • How To Invest in SpaceX Stock in 2026? Everything Investors Need to Know
    • Practice Trading Us Stocks? These Are 10 Best Stock Trading Demo Apps For Beginners
    • ​5 Best Paper Trading Platforms for 2026 (Free Demo Accounts for Beginners & Traders)
    • Wall Street’s Top 10 US Stocks for 2026 vs What Reddit Is Actually Buying
    • Is Mitrade Right for You? A Complete Guide on How to Start Trading CFDs in 5 Steps

    Click to view more