Deciding Which Stocks to Buy? Here's How to Pick Good Stocks to Invest In

Assessing Your Investment Objectives: Have a clear Investment Direction
For newbies looking to invest in stocks for the first time, learning how to pick stocks out of thousands of choices can seem overwhelming. But don’t worry, this guide will get you moving on the right path, whether you are looking for short-term trading profits or long-term capital appreciation. We will look at what factors you should consider in choosing what stocks to invest in as well as when to buy them.
How you pick stocks depends a lot on your investment time frame. I would consider any time frame from minutes to a few months as short-term and one to five years or more as long-term. Which time frame you choose depends on both your own investment goals and your personal factors such as risk tolerance, personality, and time constraints.
Are you looking for quick profits or investing for retirement?
Do you have many hours in a day to stare at the trading screen?
Furthermore, short-term trading is inherently more risky because very often, you may not know a lot about the company that you are buying. So if your risk tolerance is low and don’t have a lot of time to trade actively, then long-term investing might be for you. Lastly, short-term trading requires a certain skill set and temperament and may not be suitable for everyone.
How to Pick Stock for Long Term Investment?
When you buy stocks for the long term, you need to think of stocks as not just a symbol or number code but rather as a business. A business that you don’t manage but would like to be an owner of. The type of business that most people would like to own are very simple businesses that have good prospects for profit growth in the future. Yes, in the long term (maybe not so much in the short term), how much money a company makes is the single most important determinant of its stock price.
A company’s future profit potential depends a lot on its dominance in the industry that it operates in. Ideally, you would look for companies that have a monopolistic position in a certain market, for example, Google in search. But realistically, monopolies are rare these days so you should look for companies that are leaders within an industry that is dominated by a small number (say 2 or 3) of competitors. These companies often operate in industries that have high barriers to entry or where the network effect is greatest, that is, the more people that use the product or service, the better the product or service becomes. You would have encountered some companies with a wide moat in your everyday lives.
On the other hand, companies that you should avoid when it comes to long-term investing are companies that are losing or have lost and are unlikely to regain their leadership in an industry. Examples are Nokia and Blackberry in the smartphone world; IBM which used to be a technology leader; Kodak in the photography business.
Picking stocks for long-term investment in more competitive industries is also possible but more difficult and requires a deeper understanding of company-specific traits. Here, one factor could be strong management. Another factor could be cost advantages. Thirdly, a company may have a blockbuster new product coming that gives it an edge over many years
By now, it should be obvious that when it comes to picking stocks for long-term investment, it’s very important to first understand the business of the company and the nature of it industry. This is why a person that works in a certain industry may make a better stock pick than a top-rated analyst at an investment bank purely because of his industry knowledge. You too, should use your knowledge of a specific field to make long-term stock-picking decisions.
Apart from looking at company-specific information, if you can identify ‘secular’ trends (trends that are longer term in nature and likely to eventuate irrespective of business cycles), then most companies in the relevant industry should benefit. For example, the move to electrification and clean energy is boosting current and future demand for materials such as copper to a stage where most companies within the copper mining industry should benefit for years to come.
Picking stocks for long-term investment is not just about finding a business with great profit growth potential, the price that you pay is equally important. A stock can be a great investment at $100 and a horrible investment at $200. Here, we are talking about stock valuation, and in the investment world can be classified into two main approaches. A ‘Discounted Cash Flow (DCF) based approach or a ‘multiple-based’ approach. The former is more complex and requires inputs that are more difficult to obtain so is not the best place to start for novice investors. The latter is an easier concept to understand and is also more widely available in financial media such as the CNBC website (www.cnbc.com).
One of the most commonly known multiple-based valuation approaches is called the ‘Price-Earnings’ or ‘PE’ ratio. It is simply the stock price divided by a measure of earnings (commonly future 1-year estimated earnings):
PE Ratio = Stock Price / Annual Earnings
One way to use this PE ratio is to compare it with the same stock’s PE ratio range in past years. For example, if a stock has traded between 8x and 16x earnings in the past 10 years and the current ratio is 9x then the stock may be attractively valued if the underlying business has not changed much.
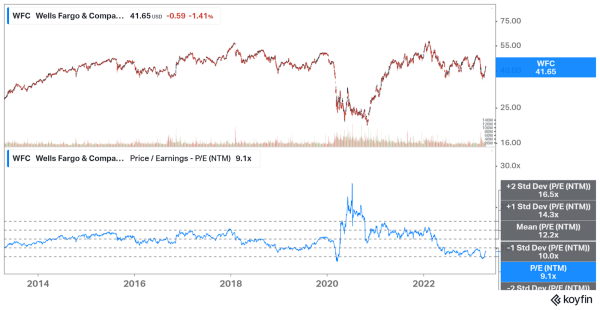
Wells Fargo & Company (WFC.US) 10-PE Ratio Range. Source: Koyfin.com
The PE ratio can also be used to compare stocks with similar businesses within the same industry (e.g. Exxon Mobil Corporation (XOM.US) vs. TotalEnergies SE (TTE.US)). In this case, if growth prospects are similar then a lower PE stock would be a better investment.
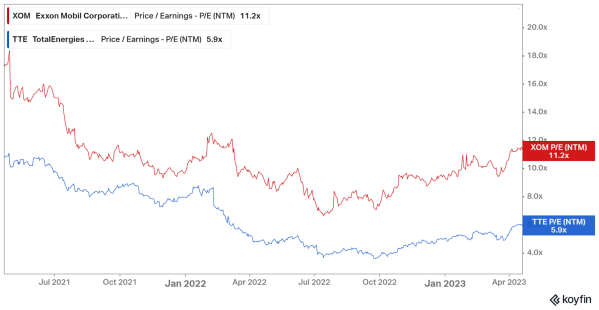
XOM.US vs. TTE.US PE Ratio over time. Source: Koyfin.com
When looking at PE ratios, it’s important to consider the reasons why it may be high or low and take that into account in your assessment.
First, a high PE ratio may be warranted if earnings growth prospects are better, whether it be relative to the past or vs. another company. Conversely, PE ratios can collapse if growth prospects suddenly fall off, as was the case with Netflix in early 2022.
Second, a PE ratio could be low because profits are highly volatile or risky (as in the case of cyclical businesses such as energy or commodities or if the company has a lot of debt). Thirdly, a PE ratio may be high because of macroeconomic reasons such as interest rates and central bank policy.
For these reasons, investors need to be aware of the reasons why a PE ratio is low or high and PE ratios are generally less relevant when comparing across industries. To put things simply, you want to buy a stock when its PE is depressed for any short-term reason but you are confident that the company’s long-term earnings growth prospects are intact and no material change has occurred from a long-term perspective.
Long-term stock picking is less technical than short-term trading and most novice investors should do just fine provided they stick to the two core principles of safe investing, i.e., diversification and not using leverage. Simply find great businesses and buy them when they are ‘on sale’.
How to Pick Stock for Short Term Investment?
When you are picking stocks for the long term, your main consideration should be of a fundamental nature, because in the long run, stock prices track earnings. However, when you are picking stocks for short-term trading, you are not planning on ‘waiting’ for price action, instead, you are looking for indications that a certain price action is about to happen or has already started and is likely to continue. As such, short-term stock picking relies mainly on technical considerations such as technical indicators, stock chart patterns, or certain events (e.g. earnings announcements) that are likely to trigger a move. There are numerous technical indicators used in practice, here, we will look at a few of the most popular ones.
Short Term Stock Picking based on Technical Indicators
Short-term stock picking can be based on historical trends and apart from simply looking at a chart to see whether a stock is trending higher or lower, some traders would consider the stock’s historical simple moving average (SMA) stock price line. These simple moving averages are most commonly calculated based on the last 50 or 200 trading days. An upward-sloping line is generally considered an upward trend and a positive sign, especially if the stock price is currently sitting above that line. Conversely, a downward-sloping moving average line is indicative of a downward price trend, particularly if the stock price is currently sitting below the line. Another commonly used moving average is the 21-day Exponential Moving Average (EMA) with the added advantage that this moving average places more importance on the most recent trading days. You can use the EMA in the same way that you use SMAs.
Apart from trend indicators, there are also momentum indicators. As its name implies, these indicators describe the speed, magnitude, or strength of recent stock price movements. A popular momentum indicator is called the Moving Average Convergence/Divergence or simply “MACD”. The MACD indicator consists of two lines and a histogram. The first is called the MACD line (blue line in the chart below) and is calculated as the difference between the 12-period (normally days) EMA and the 26-period EMA. The second is called the ‘signal line’ (red line in the chart below) and is calculated as the 9-period EMA of the MACD line. Finally, the histogram shows the difference between the MACD line and the signal line with green bars for positive readings and red bars for negative readings. Don’t worry, you do not need to know how the lines are calculated in order to use the indicator.
One popular way to use the MACD indicator is to look for cross-overs between the MACD line and the signal line. As shown in the chart below a crossing of the MACD line from below to above the signal line is taken to be a bullish sign. Conversely, a crossing of the MACD line from above to below the signal line is taken as a bearish sign. After a line cross-over event, an even stronger signal is given by the MACD line going above or below the zero midpoints.
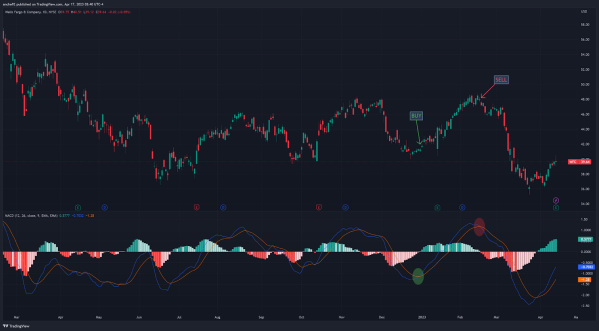
WFC.US price chart with MACD. Source: Tradingview.com
Short Term Stock Picking based on Chart Patterns
Apart from looking at different indicators, technical analysis is also concerned with examining chart patterns to determine the next probable move for a stock price. Here are simple descriptions of four commonly used chart patterns: Head and shoulders; Double tops (bottoms); Ascending triangle; and Descending triangle.
Read more: Top 20 Chart Patterns Seasoned Forex Traders Use To Boost Results
Head and Shoulders/Inverse Head and Shoulders Pattern
As shown in the chart below, the head and shoulders chart pattern is characterized by a stock price peak (head) that is in between two lower peaks (the shoulders). The two lower peaks are sometimes symmetrical but do not have to be. In this chart pattern a breach of the ‘neckline’, or where the two stock price troughs were made is taken as a bearish (SELL) signal. The Inverse head and shoulders pattern is simply the head and shoulders pattern but flipped upside-down to indicate a reversal from a declining trend to an upward trend.
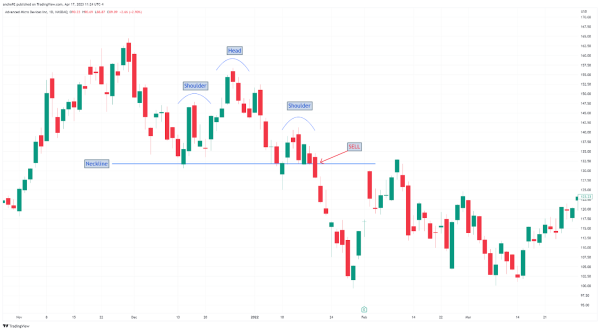
AMD.US with head and shoulders chart pattern (2022). Source: Tradingview.com
Double Tops (bottoms)
Similar to a head and shoulders pattern, a double top/bottom chart pattern also signals a reversal in trend. As show in the chart below, a bullish signal occurs when the stock price rises above the ‘neckline’ that the stock price has recently peaked following the first ‘bottom’.
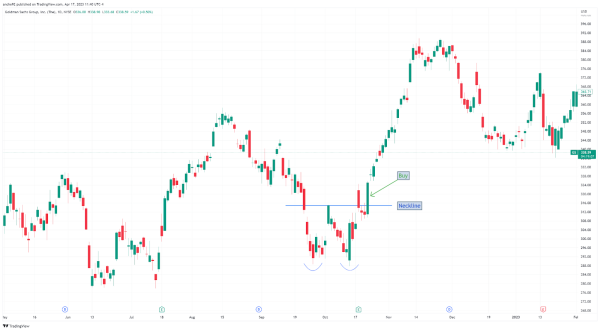
GS.US with double bottom chart pattern (2022). Source: Tradingview.com
Ascending Triangle
An ascending triangle pattern is a pattern that indicates the stock price is likely to continue moving higher. In this chart pattern, the ‘support’ line slopes upward, indicating that each successful low point is higher than the previous one. Eventually the stock price breaks above a horizontal line that matches two or more previous peaks in the pattern.
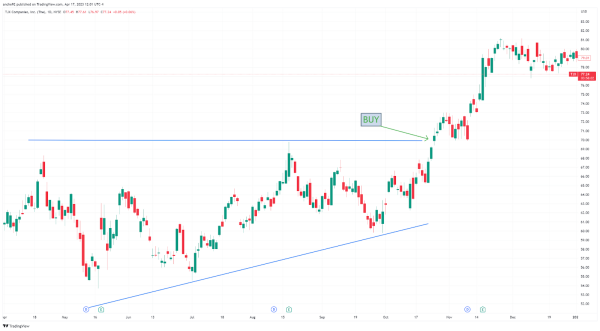
TJX.US with ascending triangle chart pattern (2022). Source: Tradingview.com
Descending Triangle
A descending triangle pattern is a pattern that indicates the stock price is likely to continue its previous trend of moving lower. In this chart pattern, the ‘resistance’ line slopes downward, indicating that each successful high point is lower than the previous one. Eventually, the stock price breaks below a horizontal line that matches two or more previous troughs.
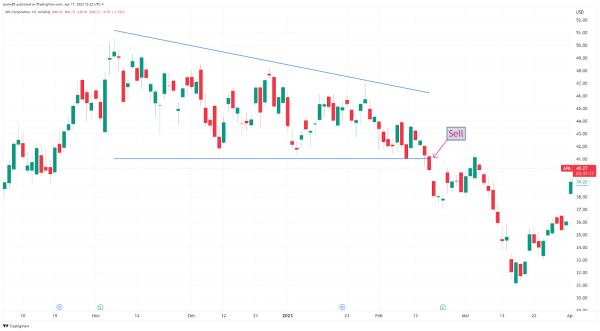
APA.US with descending triangle chart pattern (2022, 2023). Source: Tradingview.com
Best Stocks to track in 2023
Up to now, there is a lot to digest. To help you understand some of the above principles, I have included here some simple analyses of three stocks that I believe are worthy of attention for the remainder of 2023.
CF Industries (CF.US)
CF Industries is a producer of nitrogen fertilizers. So far in 2023, the stock has been hurt by weakness in nitrogen prices. However, the stock trades at an attractive PE ratio of 7.2x vs. a 5-year average of over 18x. The company has a competitive edge over European producers that pay higher prices for natural gas, which is a key input used in nitrogen production.
Bank of America (BAC.US)
The stock suffered from the crisis in US regional banks in 2023. However, trouble for smaller US lenders actually benefits large money-center banks such as Bank of America as these banks are perceived to be safer.. The stock trades at a forward PE ratio of 8.9x vs. a five-year average of over 12x.
Qualcomm (QCOM.US)
Qualcomm has traditionally been focused on the mobile chip segment. However, the company has diversified into other markets such as chips for the auto industry and the Internet of Things (IoT). The stock deserves a higher PE ratio than in the past given that earnings should prove to be more resilient. However, the stock is currently trading at 12.8x future earnings vs. a 5-year average of over 17x.
In the long term stock prices follow company profits. So picking stocks for long-term investment is best done by analyzing company fundamentals and its competitive position within the industry in which it operates.
However, the analysis does not end there, the price is what you actually pay for the business so stock valuations do matter. In contrast, stock picking for short-term trading is mainly driven by technical considerations. Despite the difference in emphasis between the two-time frames, the best investment results are often achieved when both fundamental and technical factors arrive at the same investment decision.
* The content presented above, whether from a third party or not, is considered as general advice only. This article should not be construed as containing investment advice, investment recommendations, an offer of or solicitation for any transactions in financial instruments.


