


Micron Stock Price Forecast: Stock May Hit $509 as AI Memory Shortage and NAND Price Cut Expectations Coexist
TradingKey - Micron Technology (MU) has already pre-sold 75% of its projected 2027 supply and begun negotiating supply agreements for 2028 with customers. Micron Chief Executive Officer Sanjay Mehrotra said at the TomorrowX Summit in Austin, Texas, that the volume customers want to purchase over the next five years has exceeded what the company can currently commit to deliver. He expects that supply in 2027 and 2028 could be even tighter than in 2026.
Micron has reportedly signed 26 multi-year supply and collaboration agreements involving a total of $32 billion in prepayments and other financial commitments. Some agreements require customers to purchase or pay as agreed, allowing Micron to determine how much future capacity already has buyers before investing capital to build wafer fabs. For a chipmaker whose capacity expansion takes several years, this is the most direct value of long-term agreements.
HBM Expansion Supports DRAM Prices as NAND Faces Another Cycle
When AI agents execute multi-step tasks, they need to repeatedly invoke models and retrieve data. For AI servers, whether processors can operate efficiently depends in part on whether memory can feed data quickly enough, which has driven up demand for high-bandwidth memory (HBM). Expanding HBM production also impacts commodity DRAM used in standard servers and PCs: producing the same capacity of HBM consumes roughly three to four times as many wafers as commodity DRAM, meaning the more manufacturing resources chipmakers allocate to HBM, the tighter capacity becomes for commodity products.
TrendForce projects that wafers used by Samsung Electronics, SK Hynix, and Micron to produce HBM will rise from about 23% of the three chipmakers' total DRAM wafer input in 2026 to nearly 30% in 2027. The research firm estimates that HBM4 prices will reach $3 to $5.50 per Gb in 2027, and commodity DRAM prices are also expected to remain firm, though quarter-over-quarter price gains will narrow from 5% to 10% in the first quarter to 0% to 5% per quarter in the second half. This indicates that while Micron's DRAM business still has price support, the headroom to continue driving profit growth through price increases may narrow quarter by quarter.
For Micron investors, the most critical factor to monitor in 2027 is the extent to which HBM shipment growth and commodity DRAM pricing strength can offset the impact of falling NAND prices. Around 2028, as new capacity from multiple chipmakers progressively comes online, determining whether supply remains tight will also hinge on whether customers are willing to place additional orders beyond fulfilling their existing long-term agreements.
Micron Technical Analysis
From a technical perspective, Micron closed at $594.51 on the daily chart, breaking below its prior low of around $650 from early November and confirming a downward breakdown of its recent rebound structure. Meanwhile, the stock lost the 1.272 Fibonacci extension reference level ($637.21), shifting price action from a consolidation above the prior low into an extended decline.
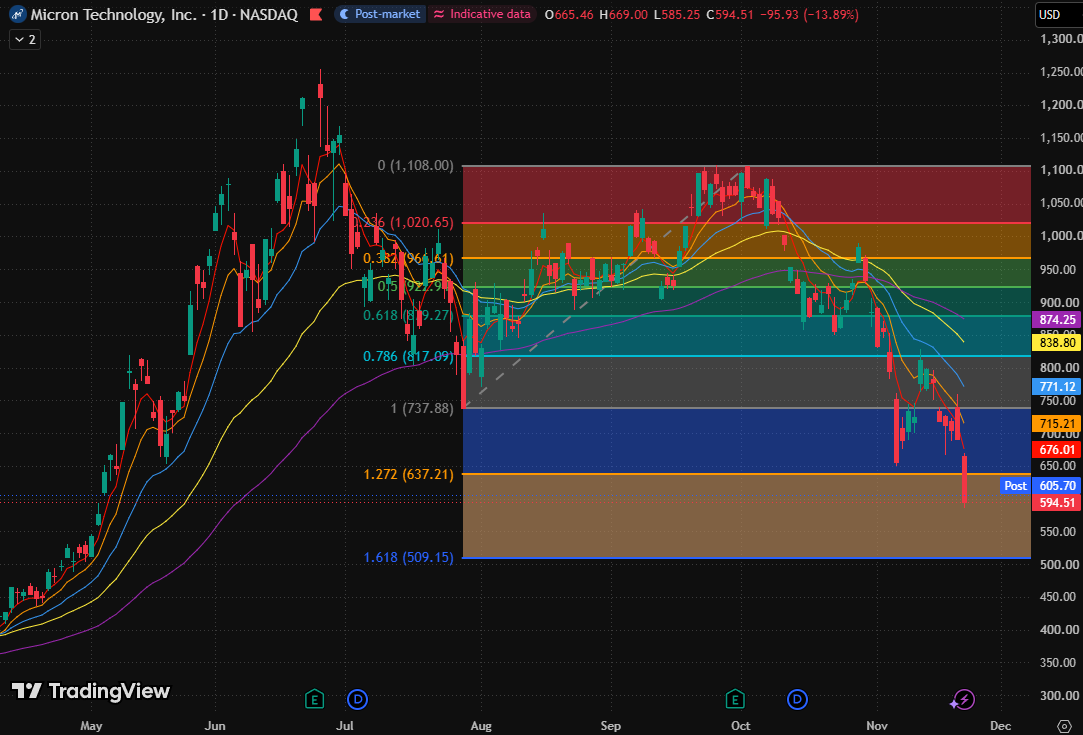
Micron daily stock price chart, Source: TradingView
Micron closed today below the 1.272 Fibonacci extension reference level ($637.21). The stock also hit a new low below its sharp drop in early November, turning the prior rebound following the breakdown into a new leg lower.
In an optimistic rebound scenario, only if the daily chart first reclaims $637.21, then climbs back above the prior low of around $650 and holds it on a pullback, could this breakdown see initial repair. The next resistance on a rebound is the $669.00–$676.01 zone, formed by the recent daily high and the 5-day exponential moving average.
The primary risk is that the stock fails to recover after losing $585.25. This would cause the daily chart to form another lower low, with the 1.618 Fibonacci extension level ($509.15) viewed as the next support.
Recommended Articles


