


I Bought This Nearly 12%-Yielding ETF For Passive Income. Here's the Catch I Checked Before Buying.
Key Points
The T. Rowe Price Capital Appreciation Premium Income ETF has paid a nearly 12% yield over the past year.
The fund's strategy aims to provide income while growing value for investors.
Those dual objectives align perfectly with my investment goals.
- 10 stocks we like better than T. Rowe Price Exchange-Traded Funds - T. Rowe Price Capital Appreciation Premium Income ETF ›
It's easy to find an ETF offering a double-digit yield these days, as new ones are popping up all the time. Finding one that can deliver substantial income without sacrificing long-term returns is much harder. That's why the T. Rowe Price Capital Appreciation Premium Income ETF (NYSEMKT:TCAL) caught my attention. It offers a trailing distribution yield approaching 12%.
However, before buying shares, I checked whether its generous distributions were real income or simply a return of capital. Here's what I found and why I'm buying shares for passive income.
Missed Nvidia in 2009? This Rare Signal Is Flashing Again. In 2009, a "Double Down" signal flashed for a little-known chipmaker called Nvidia. For the first time in years, that same "Total Conviction" signal is flashing for a company 1/100th the size of Nvidia. Continue »

Image source: Getty Images.
Why TCAL caught my attention
TCAL use a different strategy than many covered call ETFs. Most of these funds hold a portfolio of stocks but write calls on an index (e.g., S&P 500 Index or Nasdaq-100 Index) to generate options premium income that they distribute to investors. TCAL holds an actively managed portfolio of high-quality U.S. companies and writes covered calls on each holding. It also writes call options with strike prices further out of the money (above the current market price) than its peers to manage strike prices more effectively.
The fund's managers take a bottom-up approach, focusing on the fundamentals of the individual stock rather than the overall economy or market cycle. They're seeking to invest in companies that can deliver an attractive total return (price appreciation and dividend income) that they can enhance by writing call options for additional income. The goal is to provide regular income for distribution to investors while aiming for capital preservation with the potential for capital appreciation.
The catch I checked before buying
The catch with many covered call and other income ETFs is that these funds are simply returning money to investors, resulting in a steadily declining net asset value. One of TCAL's stated goals is capital preservation with the potential for capital appreciation. While the fund's share price has declined nearly 8% since its inception early last year, that's due to lower prices for some of its underlying holdings, not because it's returning capital to boost its income yield.
The fund's call-writing strategy has helped offset the lower returns of its underlying holdings since inception. It has delivered an 11.8% income return over the last 12 months, including dividends received and call premiums generated. However, that income has been lumpy:
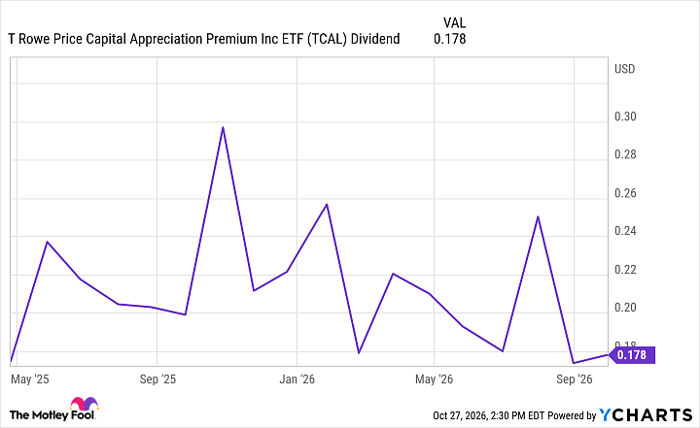
TCAL Dividend data by YCharts
That's due to differences in premium income from month to month.
Why TCAL still earned a place in my portfolio
I'm currently turning my brokerage account into a defensive portfolio that could help me retire early if AI disrupts my writing career. Part of my strategy is to build an income sleeve that can cover some of my living expenses, so I won't have to sell stocks right away if there's a market crash right when my freelance writing income comes under pressure.
TCAL is an ideal fit for that part of my portfolio. It provides broad sector diversification (its top industry is healthcare at 22%, compared to the S&P 500, which is nearly 40% tech). It also delivers meaningful monthly income, with a nearly 12% trailing 12-month yield. The fund provides those benefits for a rather modest fee (a 0.34% expense ratio, which is lower than that of many other covered call ETFs).
While the fund has its drawbacks, including that calls cap some upside potential, the income fluctuates each month, and it retains downside exposure to the stocks it holds, it still fits this aspect of my strategy well. I plan to build this ETF sleeve to around 5% of my defensive portfolio, with TCAL becoming one of the two core positions I'm building around.
An actual income enhancer
TCAL's nearly 12% trailing distribution yield makes it an intriguing choice for investors seeking monthly income. While some income funds simply return an investor's capital under the pretense of income, this ETF generates real income while preserving and growing value for investors. I see TCAL as a potentially useful complement to traditional dividend investments, not a replacement for them. That's why it has earned a place in my defensive income portfolio.
Should you buy stock in T. Rowe Price Exchange-Traded Funds - T. Rowe Price Capital Appreciation Premium Income ETF right now?
Before you buy stock in T. Rowe Price Exchange-Traded Funds - T. Rowe Price Capital Appreciation Premium Income ETF, consider this:
The Motley Fool Stock Advisor analyst team just identified what they believe are the 10 best stocks for investors to buy now… and T. Rowe Price Exchange-Traded Funds - T. Rowe Price Capital Appreciation Premium Income ETF wasn’t one of them. The 10 stocks that made the cut could produce monster returns in the coming years.
Consider when Netflix made this list on December 17, 2004... if you invested $1,000 at the time of our recommendation, you’d have $337,166!* Or when Nvidia made this list on April 15, 2005... if you invested $1,000 at the time of our recommendation, you’d have $1,339,143!*
Now, it’s worth noting Stock Advisor’s total average return is 904% — a market-crushing outperformance compared to 213% for the S&P 500. Don't miss the latest top 10 list, available with Stock Advisor, and join an investing community built by individual investors for individual investors.
See the 10 stocks »
*Stock Advisor returns as of October 29, 2026.
Matt DiLallo has positions in T. Rowe Price Exchange-Traded Funds - T. Rowe Price Capital Appreciation Premium Income ETF. The Motley Fool has positions in and recommends T. Rowe Price Exchange-Traded Funds - T. Rowe Price Capital Appreciation Premium Income ETF. The Motley Fool has a disclosure policy.
Recommended Articles


