


Worried About the September Effect? Here’s What History Tells Us About Investing During What’s Generally Been the Worst Month for Stocks.
Key Points
The S&P 500 has advanced in recent months and years, but it may be heading for a rough patch.
Investors should do one particular thing in September to favor long-term success.
- 10 stocks we like better than S&P 500 Index ›
The S&P 500's performance in recent years and recent weeks has offered investors reason for optimism. Over these past few years, the famous benchmark has soared, led by companies involved in the high-growth artificial intelligence (AI) story. These tech giants, from Nvidia to Alphabet, have delivered revenue growth thanks to their AI investments and say this opportunity is far from over.
In more recent times, investor interest has broadened into other sectors, from healthcare to consumer-oriented stocks. And better-than-expected second-quarter earnings reports from a great majority of S&P 500 companies have reinforced this momentum. About 87% of companies reported positive earnings per share surprises, while 77% reported positive revenue surprises, according to the FactSet Earnings Insight newsletter.
Missed Nvidia in 2009? This Rare Signal Is Flashing Again. In 2009, a "Double Down" signal flashed for a little-known chipmaker called Nvidia. For the first time in years, that same "Total Conviction" signal is flashing for a company 1/100th the size of Nvidia. Continue »
All of this has helped the benchmark climb -- even amid headwinds such as rising inflation and uncertainty about when the Federal Reserve will move on interest rates. Now, however, in the early trading days of September, some investors might be thinking more about the headwinds than the tailwinds. That's because of the September Effect. Let's check out what history tells us about investing during what's generally been the worst month for stocks.

Image source: Getty Images.
More often lower than higher
First, let's start by considering the phenomenon known as the September Effect. Over time, the S&P 500 has often declined in September. In fact, since 1928, it's the only month in which the benchmark has ended lower more often than higher, according to Citadel Securities. And over that time period, the index declined an average of 1.1%, Citadel's report showed.
What's the reason for this movement? No one has identified one clear explanation. Some suggest that institutional investors, aiming to lock in profits at the end of the quarter in preparation for year-end, may contribute to it. Others say that the simple idea of a weak September pushes investors to hit the "sell" button, and this keeps the cycle going.
In any case, September declines, when they do occur, aren't linked to one specific, recurring event. And that means there isn't really a reason to avoid stocks this month. Still, why invest right now if you know there's a good chance that you may finish the month with a decline? Let's consider what history has to say.
The worst September performances
Over the past decade, the worst September performances were the following:
| Time period | S&P 500 performance |
|---|---|
| Sept. 2023 | down 4.9% |
| Sept. 2022 | down 9.3% |
| Sept. 2021 | down 4.8% |
| Sept. 2020 | down 3.9% |
| Data source: Ycharts |
The other September performances throughout this period were either positive or little changed.
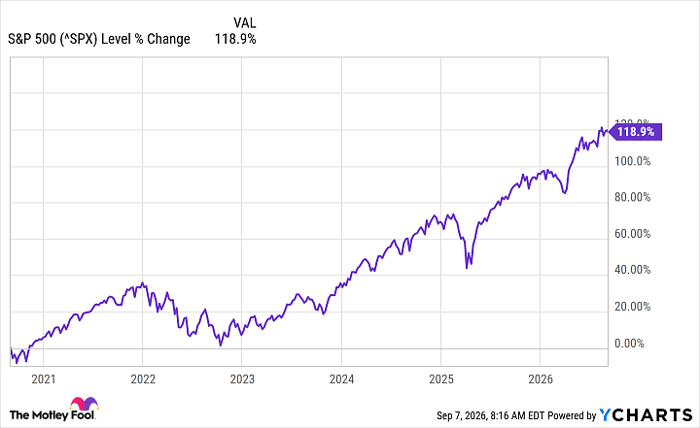
Now, in the chart below, let's take a look at the overall performance of the S&P 500 index from September 2020 through today. We can zoom in to look at the general trend after the September weak periods, and we can consider the entire 10-year time frame.
^SPX data by YCharts
From both perspectives, history tells us that those who invested in September actually scored a win over the mid-to-long term. So, even if investors experienced a September dip, their gains over a number of months and years more than compensated for the September Effect.
Now, you might ask: Wouldn't it be a better idea to wait out this month and invest at the start of October? Not necessarily, and here's why. First, it's impossible to time the market and get in at the very lowest point. Second, even if you could time the market, it wouldn't make a huge difference in your returns over the long term. Finally, if you wait to invest, you could miss out on a great opportunity -- for example, a stock trading at a bargain today may no longer be a bargain a month from now. It's important to invest throughout investment cycles and avoid focusing on near-term headwinds.
All of this means that, even though stocks often slip in September, the best thing you can do is keep investing in quality, reasonably priced stocks. History shows us that, overwhelmingly, investors who ignore the September Effect and continue investing score a win over the long run.
Should you buy stock in S&P 500 Index right now?
Before you buy stock in S&P 500 Index, consider this:
The Motley Fool Stock Advisor analyst team just identified what they believe are the 10 best stocks for investors to buy now… and S&P 500 Index wasn’t one of them. The 10 stocks that made the cut could produce monster returns in the coming years.
Consider when Netflix made this list on December 17, 2004... if you invested $1,000 at the time of our recommendation, you’d have $421,997!* Or when Nvidia made this list on April 15, 2005... if you invested $1,000 at the time of our recommendation, you’d have $1,413,876!*
Now, it’s worth noting Stock Advisor’s total average return is 978% — a market-crushing outperformance compared to 213% for the S&P 500. Don't miss the latest top 10 list, available with Stock Advisor, and join an investing community built by individual investors for individual investors.
See the 10 stocks »
*Stock Advisor returns as of September 8, 2026.
Adria Cimino has no position in any of the stocks mentioned. The Motley Fool has positions in and recommends Alphabet and Nvidia. The Motley Fool has a disclosure policy.
Recommended Articles


