


The Stock Market Is Flashing a Warning Seen Only 6 Times Since 1871, and History Is Crystal Clear That a Disaster Could Be Heading Toward Wall Street
Key Points
The CAPE ratio accounts for 10 years' worth of inflation-adjusted earnings, making it helpful for gauging long-term market trends.
While history suggests a correction could be on the horizon, timing is a key variable to consider.
CAPE readings that surpass 30 for months at a time always precede a sell-off.
- 10 stocks we like better than S&P 500 Index ›
There is a reason the S&P 500 (SNPINDEX: ^GSPC), Dow Jones Industrial Average (DJINDICES: ^DJI), and Nasdaq Composite (NASDAQINDEX: ^IXIC) are among the greatest wealth creation vehicles in financial history.
With indexes, you don't need to time the market or pick the next Nvidia (NASDAQ: NVDA). You also don't need to hop from gold to oil to real estate every time an economic outlook shifts. Over decades, owning productive businesses has been one of the most reliable passive ways to build wealth.
Missed Nvidia in 2009? This Rare Signal Is Flashing Again. In 2009, a "Double Down" signal flashed for a little-known chipmaker called Nvidia. For the first time in years, that same "Total Conviction" signal is flashing for a company 1/100th the size of Nvidia. Continue »
Simply put, companies generate earnings, reinvest capital, create new products, authorize share buybacks, and issue dividends, all while growing alongside the economy. This compounding effect is difficult for alternative assets to replicate over a long-term horizon.
With that said, investing in the stock market is not always smooth sailing. The catch is that the stock market can be an incredible source of wealth while also becoming unusually expensive from time to time. Right now, the price investors are paying for the stock market is the key variable to note.
Image source: Getty Images.
The stock market is doing something for only the sixth time in 155 years
On the surface, investors have plenty of reasons to be bullish as the major indexes hover around record highs. Artificial intelligence (AI) has unleashed an unprecedented capital spending cycle around data centers, graphics processing units (GPUs), networking, memory, power, and everything else needed to build out the AI infrastructure stack. There is a potential glitch in the AI machine, however.
Some investors are becoming increasingly concerned that new Federal Reserve Chairman Kevin Warsh could hike interest rates. The math tells us that if rates move higher, the cost of capital rises as well. This matters for an economy that's pouring hundreds of billions of dollars into AI infrastructure on an annual basis. Since the AI build-out is one of the core pillars supporting the current market rally, anything that threatens the capex cycle's pace could fuel a nasty repricing.
To be sure, I'm not personally distracted by monetary policy decisions. Instead, I am laser-focused on valuation, and so it's natural to immediately look at the price-to-earnings (P/E) ratio to determine whether a stock is expensive or reasonably valued. The problem with this approach is that P/E multiples can be noisy.
The reason is that a company's earnings can fall during a recession or be boosted by a temporary boom. This means that looking at just one year of earnings can give an incomplete picture of what a business is actually capable of earning during the course of a full economic cycle. This is where the CAPE ratio comes in.
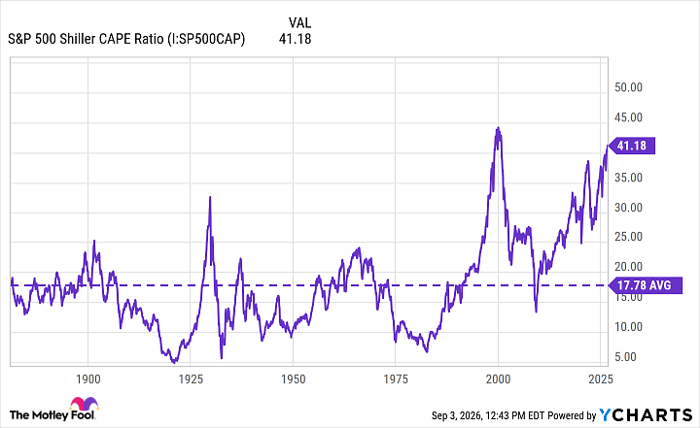
The cyclically adjusted price-to-earnings (CAPE) ratio, or the Shiller P/E, smooths out valuation noise by measuring stock prices with average inflation-adjusted earnings over a 10-year horizon. This makes valuation readings less distorted by one unusually good or bad year.
CAPE readings have been backdated to 1871, giving investors 155 years of historical context. The average CAPE level during this period is about 17.8. Currently, the CAPE's reading of 41.1 is more than double its long-term average.
S&P 500 Shiller CAPE Ratio data by YCharts.
What happens when the CAPE ratio rises?
There have been six periods when the CAPE ratio sustained a reading of 30 or more for consecutive months during a broader bull market. Right now is one of those times. Let's see how the previous five periods played out.
- 1929: Stock prices peaked during the Roaring Twenties. For historians, what followed is obvious: the infamous 1929 crash and the devastating bear market that plagued the early 1930s.
- 1997 to 2001: During this period, the CAPE reached its all-time high of about 44 as the dot-com boom accelerated. The tech-heavy Nasdaq soared for years, proving that a frothy market can become even more expensive. The optimism, however, was largely supported by nothing more than hope and euphoria. Eventually, the bubble burst, and the Nasdaq dropped roughly 77% from its peak to trough.
- 2017 to 2018: The S&P 500 climbed for nearly a year before the market experienced a sharp sell-off during the fourth quarter of 2018.
- 2019 to 2020: Stocks were soaring heading into 2020. But within the first two months of the year, the S&P 500 stumbled into a brief bear market as the global economy effectively shut down due to the COVID-19 pandemic. Although the recovery was extraordinarily fast, the timing and scale of the initial decline were severe.
- 2020 to 2022: After the pandemic-driven crash, stock prices quickly recovered thanks to monetary stimulus and ultra-low interest rates. The rally eventually came to a halt when inflation peaked at about 9%, prompting the Fed to raise interest rates. The S&P 500 entered a bear market in 2022, and high-growth technology stocks in particular suffered deep losses.
What should investors do if the stock market crashes?
There is an important nuance in the analysis explored in this piece. Specifically, a CAPE ratio above 30 does not mean price will soon fall -- the market can remain expensive for a surprisingly long time. This is why valuation is best viewed as a warning light, not as a stop sign.
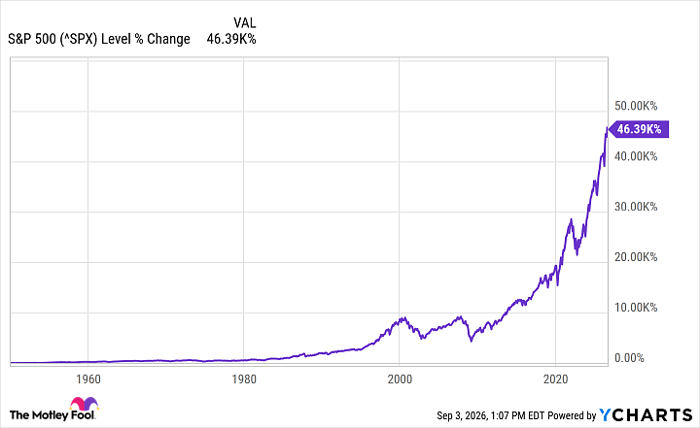
Although history suggests a disaster should follow an expensive market, it does not definitively tell us when such an event will occur. History also teaches investors that the stock market survives bubbles, recessions, wars, inflationary shocks, and financial crises -- always coming out the other side and reaching new highs.
^SPX data by YCharts.
This is the entire point of staying invested for the long haul. Investors can't control when a correction or crash will inevitably arrive. What they can control is how exposed they are when volatility comes. The biggest mistake an investor can make right now is to confuse an expensive market with a broken one. The same market that brings painful corrections also produces the recoveries that create long-term wealth.
It's a good idea to always keep some cash on hand instead of being 100% invested in stocks. By doing so, you can buy quality businesses at more attractive prices during a downturn. Trimming speculative positions while continuing to own high-quality businesses can help mitigate the blow should the market start to sell off. Diversifying to defensive plays outside the technology industry that has driven much of the market's recent rally is also a good way to hedge against dips in growth stocks.
Although a CAPE reading within shouting distance of all-time highs should make investors cautious about future returns, it shouldn't convince you that the stock market is headed for irreversible damage. Ultimately, the goal isn't to predict when a crash will happen. Rather, your goal should be to build a portfolio that can survive one, while anticipating when the next bull market inevitably begins.
Should you buy stock in S&P 500 Index right now?
Before you buy stock in S&P 500 Index, consider this:
The Motley Fool Stock Advisor analyst team just identified what they believe are the 10 best stocks for investors to buy now… and S&P 500 Index wasn’t one of them. The 10 stocks that made the cut could produce monster returns in the coming years.
Consider when Netflix made this list on December 17, 2004... if you invested $1,000 at the time of our recommendation, you’d have $421,997!* Or when Nvidia made this list on April 15, 2005... if you invested $1,000 at the time of our recommendation, you’d have $1,413,876!*
Now, it’s worth noting Stock Advisor’s total average return is 978% — a market-crushing outperformance compared to 213% for the S&P 500. Don't miss the latest top 10 list, available with Stock Advisor, and join an investing community built by individual investors for individual investors.
See the 10 stocks »
*Stock Advisor returns as of September 7, 2026.
Adam Spatacco has positions in Nvidia. The Motley Fool has positions in and recommends Nvidia. The Motley Fool has a disclosure policy.
Recommended Articles


