


History Says This 1 ETF Could Turn $1,000 into $28,289 in 20 Years. Here's the Math.
Key Points
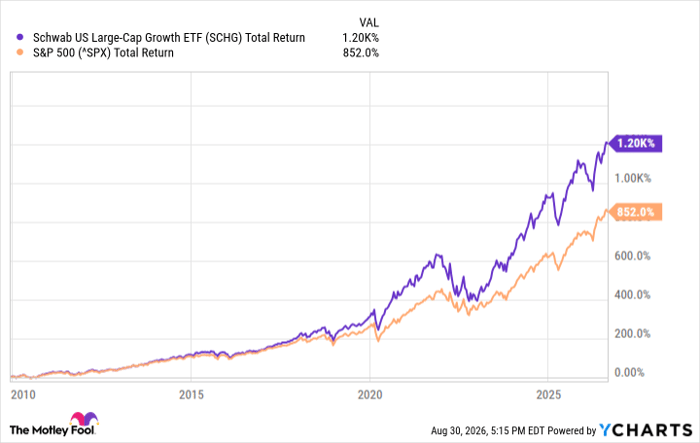
The Schwab U.S. Large-Cap Growth ETF (SCHG) has outperformed the S&P 500 since December 2009, and has done even better in the past 10 years.
If SCHG delivers the same 18.2% average annual return for the next 10 years, it could skyrocket your investment growth.
- 10 stocks we like better than Schwab Strategic Trust - Schwab U.s. Large-Cap Growth ETF ›
Strong earnings and excitement around the artificial intelligence (AI) boom have made U.S. growth stocks a great way to invest over the past 10 to 15 years. One low-cost exchange-traded fund (ETF) that makes it easy to invest in a targeted portfolio of America's largest, fastest-growing companies is the Schwab U.S. Large-Cap Growth ETF (NYSEMKT: SCHG).
This Schwab fund launched in December 2009 and has a strong track record of performance. SCHG delivered average annual returns (by net asset value) of 16.4% since the fund's inception. It has strongly outperformed the S&P 500 index (SNPINDEX: ^GSPC):
Missed Nvidia in 2009? This Rare Signal Is Flashing Again. In 2009, a "Double Down" signal flashed for a little-known chipmaker called Nvidia. For the first time in years, that same "Total Conviction" signal is flashing for a company 1/100th the size of Nvidia. Continue »
Data by YCharts.
What if the Schwab U.S. Large-Cap Growth ETF can keep growing strong for the next 15 years and beyond? Let's see how your money could grow with this low-cost growth stock ETF.

Image source: Getty Images.
Schwab U.S. Large-Cap Growth ETF (SCHG): 10 years of 18.2% annualized returns
The Schwab U.S. Large-Cap Growth ETF is not a broadly diversified total stock market index fund. Instead, it offers a more targeted portfolio of 196 large-cap stocks expected to exhibit strong growth-style characteristics. SCHG charges an ultra-low expense ratio of 0.04%, which is lower than what many popular tech ETFs charge.
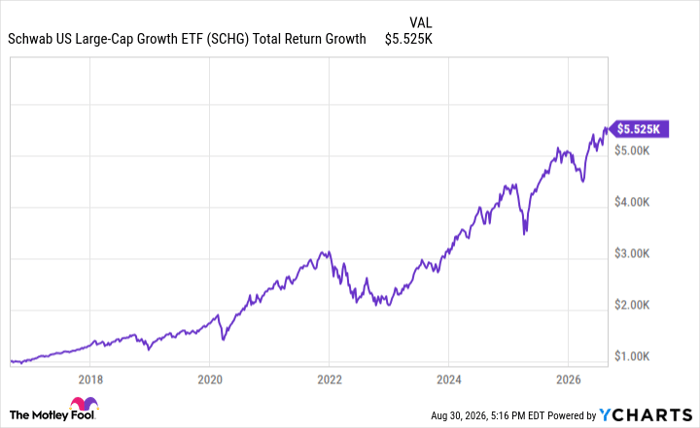
SCHG has outperformed the S&P 500 since December 2009. But the past 10 years have been even better for this growth stock fund. In the past 10 years, SCHG has delivered annualized returns of 18.2%. If you had invested $1,000 in SCHG 10 years ago, you'd have $5,525 today (with dividends reinvested).
Data by YCharts.
How $1,000 invested in SCHG could grow
There's no guarantee that any fund or stock will deliver the same high returns forever. But let's assume you invest $1,000 into SCHG today, and leave that money alone to grow, with dividends reinvested. And let's assume SCHG can keep earning 18.2% average annual returns along the way.
After 10 years, you would have $5,319.
After 15 years, you would have $12,266.
And after 20 years, your initial $1,000 investment would grow to $28,289.
Should you buy stock in Schwab Strategic Trust - Schwab U.s. Large-Cap Growth ETF right now?
Before you buy stock in Schwab Strategic Trust - Schwab U.s. Large-Cap Growth ETF, consider this:
The Motley Fool Stock Advisor analyst team just identified what they believe are the 10 best stocks for investors to buy now… and Schwab Strategic Trust - Schwab U.s. Large-Cap Growth ETF wasn’t one of them. The 10 stocks that made the cut could produce monster returns in the coming years.
Consider when Netflix made this list on December 17, 2004... if you invested $1,000 at the time of our recommendation, you’d have $440,710!* Or when Nvidia made this list on April 15, 2005... if you invested $1,000 at the time of our recommendation, you’d have $1,335,252!*
Now, it’s worth noting Stock Advisor’s total average return is 978% — a market-crushing outperformance compared to 213% for the S&P 500. Don't miss the latest top 10 list, available with Stock Advisor, and join an investing community built by individual investors for individual investors.
See the 10 stocks »
*Stock Advisor returns as of September 1, 2026.
Ben Gran has no position in any of the stocks mentioned. The Motley Fool has no position in any of the stocks mentioned. The Motley Fool has a disclosure policy.
Recommended Articles


