


Which High-Yield ETF Is a Better Buy in 2026: Vanguard VYM vs iShares HDV?
Key Points
Vanguard High Dividend Yield ETF offers a lower expense ratio of 0.04% compared to 0.08% for iShares Core High Dividend ETF.
iShares Core High Dividend ETF provides a more concentrated portfolio of 75 stocks with higher exposure to defensive sectors like healthcare.
Vanguard High Dividend Yield ETF includes a larger financials and technology allocation with a portfolio of over 600 stocks.
- 10 stocks we like better than Vanguard High Dividend Yield ETF ›
Both the Vanguard High Dividend Yield ETF (NYSEMKT:VYM) and the iShares Core High Dividend ETF (NYSEMKT:HDV)serve as core options for investors seeking income from U.S. dividend-paying stocks.
The Vanguard High Dividend Yield ETF offers broader market diversification and a lower expense ratio, whereas the iShares Core High Dividend ETF provides a more concentrated portfolio with a higher trailing distribution yield.
So while both ETFs share the primary goal of providing higher-than-average yields, they differ significantly in portfolio breadth, sector concentration, and cost structures, making each suitable for different types of dividend-focused strategies.
Here’s all you need to know to help you decide which ETF to invest in.
Snapshot (cost & size)
| Metric | HDV | VYM |
|---|---|---|
| Issuer | iShares | Vanguard |
| Share price | $27.90 (as of 2026-07-14) | $160.8 (as of 2026-07-14 |
| Expense ratio | 0.08% | 0.04% |
| 1-yr total return (as of 2026-07-13) | 22.2% | 20.3% |
| Dividend yield | 2.8% | 2.3% |
| Beta | 0.53 | 0.73 |
| AUM | $14B | $96.1B |
Beta measures price volatility relative to the S&P 500; beta is calculated from five-year monthly returns. The 1-yr return represents total return over the trailing 12 months. Dividend yield is the trailing-12-month distribution yield.
Performance & risk comparison
| Metric | HDV | VYM |
|---|---|---|
| Max drawdown (5 yr) | (15.40%) | (15.90%) |
| Growth of $1,000 over 5 years (total return as of 2026-07-14) | $1,717 | $1,774 |
What's inside
The Vanguard High Dividend Yield ETF tracks a broad index of 605 stocks, providing expansive diversification across the U.S. market. The portfolio is balanced between financials (19.6%), technology (16.9%), and industrials (13.9%). Its largest positions include Broadcom (NASDAQ:AVGO) at 8.51%, JPMorgan Chase & Co (NYSE:JPM) at 3.14%, and Exxon Mobil (NYSE:XOM) at 2.53%. The ETF was launched in 2006. Vanguard High Dividend Yield ETF has paid $3.63 per share over the trailing 12 months, which on its current price works out to a 2.30% yield.
iShares Core High Dividend ETF (NYSEMKT:HDV) holds only 75 stocks that meet specific yield and sustainability criteria. The fund leans heavily into defensive sectors, with consumer defensive and healthcare at 24.2% and 23.5%, respectively. Key holdings include Exxon Mobil (NYSE:XOM) at 7.3%, AbbVie (NYSE:ABBV) at 6.32%, and Chevron (NYSE:CVX) at 5.7%. The ETF was launched in 2011. iShares Core High Dividend ETF has paid $0.79 per share over the trailing 12 months, which works out to a 2.80% yield at current price.
For more guidance on ETF investing, readers can view the full guide at this link.
What this means for investors
The Vanguard High Yield ETF and the iShares Core High Dividend ETF are popular ETFs among income investors.
VYM tracks the FTSE High Dividend Yield Index. The methodology is simple: It ranks U.S. dividend-paying stocks by their forecasted 12-month yield and includes the top 50% of the market, excluding Real Estate Investment Trusts, or REITs. Because it is heavily market-cap-weighted, large companies often make it to the top, and they’re also often financially strong.
HDV follows a very different set of criteria for selecting stocks. It tracks the Morningstar Dividend Yield Focus Index, which screens for companies with strong financial health and "economic moats" using Morningstar's proprietary credit risk metrics. That filters out companies with weak fundamentals and restricts the index to the top 75 highest-yielding stocks.
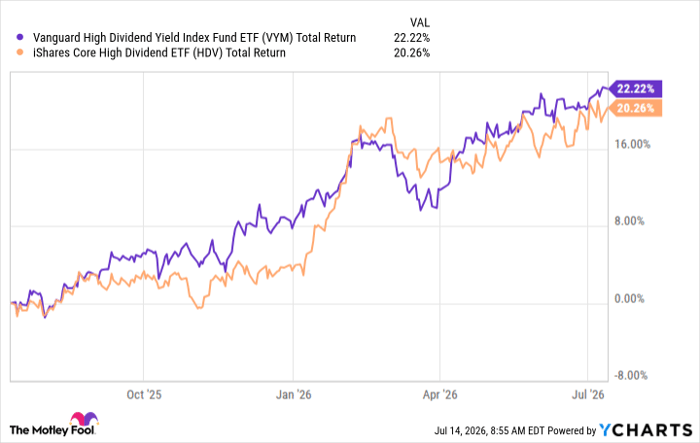
VYM Total Return Level data by YCharts
That makes VYM a highly diversified ETF with steady income, providing solid long-term growth potential at incredibly low cost. HDV is a more defensive fund that may have a smaller downside in down markets, thanks to its heavy tilt toward consumer staples and healthcare. Although its top three holdings include two energy stocks, both ExxonMobil and Chevron are among the top dividend-paying companies in the energy sector.
The portfolio composition and diversification are important factors to consider when selecting between the two ETFs. Or you could own some shares of both to earn steady, regular dividend income in 2026 and beyond.
Should you buy stock in Vanguard High Dividend Yield ETF right now?
Before you buy stock in Vanguard High Dividend Yield ETF, consider this:
The Motley Fool Stock Advisor analyst team just identified what they believe are the 10 best stocks for investors to buy now… and Vanguard High Dividend Yield ETF wasn’t one of them. The 10 stocks that made the cut could produce monster returns in the coming years.
Consider when Netflix made this list on December 17, 2004... if you invested $1,000 at the time of our recommendation, you’d have $398,160!* Or when Nvidia made this list on April 15, 2005... if you invested $1,000 at the time of our recommendation, you’d have $1,249,202!*
Now, it’s worth noting Stock Advisor’s total average return is 918% — a market-crushing outperformance compared to 209% for the S&P 500. Don't miss the latest top 10 list, available with Stock Advisor, and join an investing community built by individual investors for individual investors.
See the 10 stocks »
*Stock Advisor returns as of July 14, 2026.
JPMorgan Chase is an advertising partner of Motley Fool Money. Neha Chamaria has no position in any of the stocks mentioned. The Motley Fool has positions in and recommends AbbVie, Broadcom, Chevron, JPMorgan Chase, and Vanguard High Dividend Yield ETF. The Motley Fool has a disclosure policy.
Recommended Articles


