


The Stock Market Just Sent Its Most Confusing Signal in Years -- but History Is Clear on What Happens Next
Key Points
The stock market has been lucrative lately, but many investors are pessimistic about the future.
Some market indicators suggest volatility could be on the horizon.
However, history has proved time and again that long-term investors will thrive.
- 10 stocks we like better than S&P 500 Index ›
The stock market just capped its most lucrative quarter in years, with the S&P 500 (SNPINDEX: ^GSPC) and Nasdaq Composite (NASDAQINDEX: ^IXIC) surging by more than 14% and 20%, respectively, between early April and the end of June. However, many investors aren't feeling the same optimism.
Consumer sentiment hit its lowest point ever in May, according to the University of Michigan Consumer Sentiment Index. While it increased slightly in June, it's still below levels seen during the financial crisis of 2008, the pandemic in 2020, and the bear market in 2022.
Where to invest $1,000 right now? Our analyst team just revealed what they believe are the 10 best stocks to buy right now, when you join Stock Advisor. See the stocks »
This contradiction is unusual, as surging stock prices are typically paired with optimism around the future. According to a May 2026 poll from The Economist and YouGov, though, 63% of Americans believe the economy is worsening.
It's a confusing time to invest, but history can offer some insights on how to prepare your portfolio.

Image source: Getty Images.
Volatility may be looming, but the future is bright
The market has been reaching record high after record high over the last few years. While that's promising for investors who have already bought into the market and are now reaping the rewards, it's also a historically expensive time to invest. And according to some market indicators, we could potentially be due for a pullback.
The S&P 500 Shiller CAPE Ratio, for example, tracks the S&P 500's 10-year inflation-adjusted earnings to gauge whether the index is over- or undervalued. Like any market metric, it's not perfect and can't account for every factor influencing stock prices. But it can provide a snapshot of how valuations change over time.
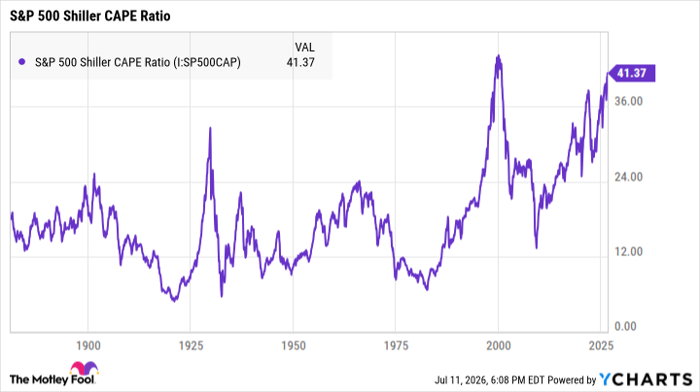
S&P 500 Shiller CAPE Ratio data by YCharts
This ratio's long-term average is around 17, and it reached a record high of 44 leading up to the dot-com bubble burst in the early 2000s. As of this writing, it's over 40.
What history says is coming next
While history can't predict the short term, it does offer resounding evidence that long-term investors will thrive over time -- with the right investments.
The S&P 500 Shiller CAPE Ratio nearing record highs doesn't necessarily mean that a downturn is around the corner. It does, however, increase the likelihood that some stocks are overvalued. Those stocks can still surge in the near term, but they're also more likely to crash harder during the next bear market.
Healthy companies built on solid foundations have the best shot at surviving even severe volatility, and history shows the stock market rewards investors who stay the course.
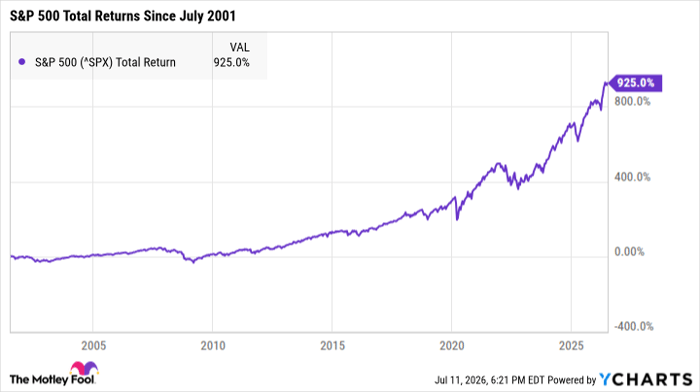
^SPX data by YCharts
Over the past 25 years alone, the S&P 500 has survived the tail-end of the dot-com bubble, the Great Recession, the COVID-19 crash, the 2022 bear market, and many other smaller corrections. In that time, it's also earned total returns of 925%.
Not all stocks survived those downturns, though. During the dot-com bubble, for instance, hundreds of overvalued tech stocks with shaky fundamentals crashed and burned.
If history proves anything, it's that strong stocks from healthy companies are the most likely to thrive over time. While the short-term future may be shaky, investors who opt for quality stocks and hold them for at least five to 10 years will be well-positioned for substantial growth.
Should you buy stock in S&P 500 Index right now?
Before you buy stock in S&P 500 Index, consider this:
The Motley Fool Stock Advisor analyst team just identified what they believe are the 10 best stocks for investors to buy now… and S&P 500 Index wasn’t one of them. The 10 stocks that made the cut could produce monster returns in the coming years.
Consider when Netflix made this list on December 17, 2004... if you invested $1,000 at the time of our recommendation, you’d have $395,679!* Or when Nvidia made this list on April 15, 2005... if you invested $1,000 at the time of our recommendation, you’d have $1,294,805!*
Now, it’s worth noting Stock Advisor’s total average return is 929% — a market-crushing outperformance compared to 211% for the S&P 500. Don't miss the latest top 10 list, available with Stock Advisor, and join an investing community built by individual investors for individual investors.
See the 10 stocks »
*Stock Advisor returns as of July 14, 2026.
Katie Brockman has no position in any of the stocks mentioned. The Motley Fool has no position in any of the stocks mentioned. The Motley Fool has a disclosure policy.
Recommended Articles


