


How Will Meta’s Stock Price Trend in the Second Half of 2026? Can It Rise to the $1,000 Mark?
TradingKey - In the first half of 2026, stock prices of tech giants such as Nvidia, Google, and Apple all hit record highs, but Meta ( META) not only fell short of this, but also showed overall weakness, plummeting over 14% cumulatively during the period and underperforming the three major U.S. stock indices. It ranked second from the bottom among the Magnificent Seven, trailing only Microsoft (which fell over 20%). So, will Meta continue its decline in the second half of the year, or will it stage a turnaround to surge to new highs and even challenge the $1,000 mark?
Meta Stock Price Trend Review: Ups and Downs
In the first half of 2026, Meta's stock price experienced wild fluctuations, characterized by two major surges and plunges, perfectly illustrating a rollercoaster ride. At the start of 2026, Meta sustained its previous strong momentum, with its stock price surging to over $730 in late January, up more than 12% from the opening price of the year's first trading day. From February to March, Meta's stock entered a period of volatile correction, falling to around $520 by late March, representing a 28% pullback from its January peak.
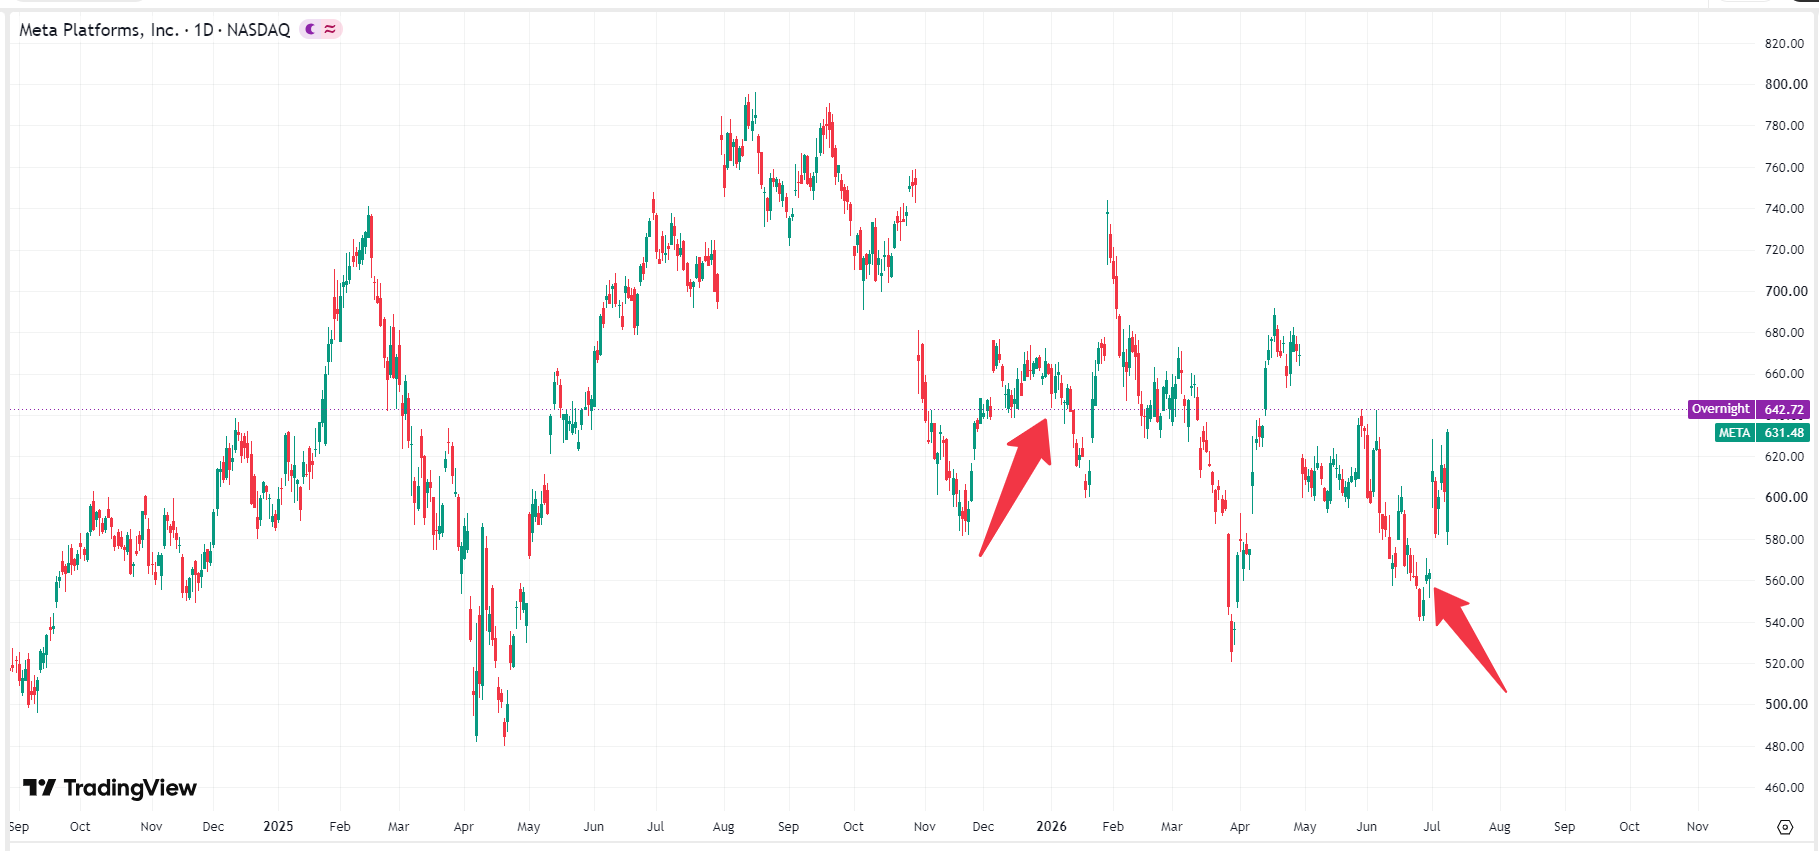 Meta stock price chart, Source: TradingView
In early April, Meta's stock price bottomed out and rebounded, surging to $690 by mid-month, representing a cumulative gain of 32% in just half a month. However, Meta was unable to sustain this upward momentum, subsequently drifting lower amid volatility and suffering heavy sell-offs in mid-to-late June, even retesting yearly lows around $520 to $560. Ultimately, Meta's stock ended the first half of the year at $563.10 on June 30, down approximately 14% since the beginning of the year.
Why Meta Shares Are Falling?
The decline in Meta's stock price in the first half of the year was characterized by two major sell-offs, the first in February-March and the second in May-June. While each downturn coincided with macroeconomic backdrops such as fluctuating Federal Reserve interest rate policy and collective profit-taking in tech stocks, Meta's own fundamentals and earnings performance indicate the core drivers revolved around the 'fear of a bottomless pit in AI capital expenditure' and 'short-term noise in core metrics'.
Meta's fourth-quarter 2025 earnings report, released at the end of January, showed that while core advertising revenue was highly impressive, management disclosed full-year 2026 capital expenditure (CapEx) guidance for the first time—at a whopping $115 billion to $135 billion. This figure is nearly double that of the previous year. The market realized that this massive spending would severely erode short-term free cash flow, shaking the confidence of bulls and prompting collective institutional profit-taking at high levels.
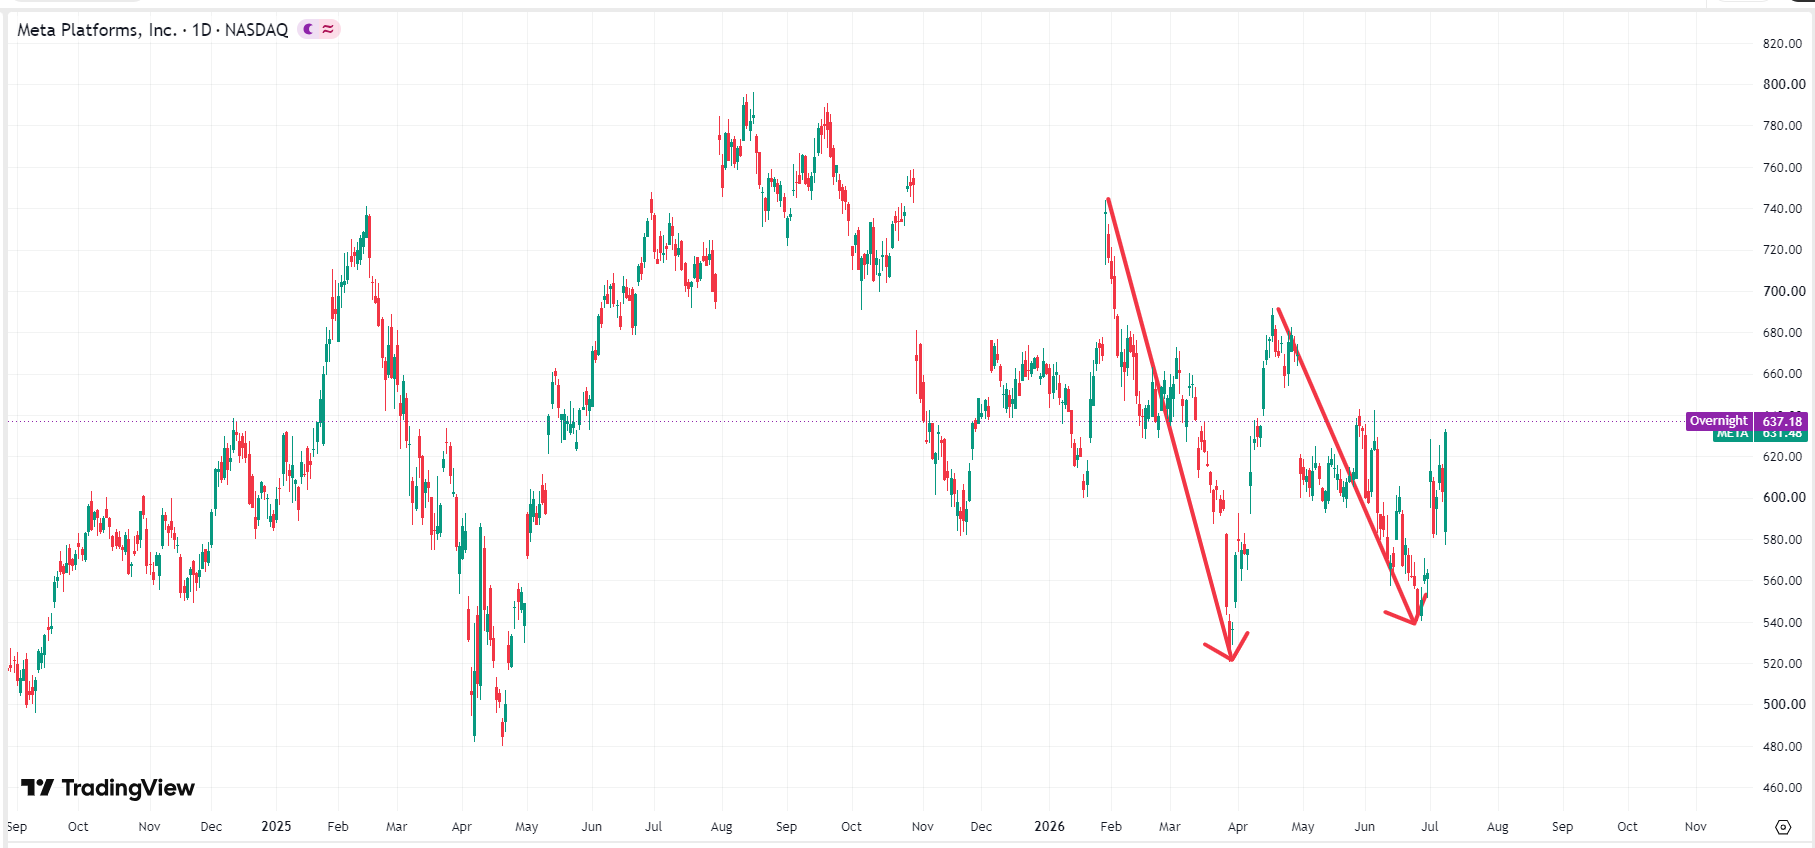 Meta stock price chart, Source: TradingView
At the end of April, Meta released its Q1 2026 earnings report, which showed that earnings per share (EPS) significantly beat expectations. However, CFO Susan Li dropped another bombshell during the call, raising the full-year 2026 capital expenditure guidance further to $125 billion to $145 billion. This implies that Meta's free cash flow faces severe compression and could even turn negative in 2026-2027, triggering collective market panic. In addition, global daily active users (DAUs) for Meta's Family of Apps (FB, IG, WhatsApp) stood at 3.56 billion, which was not only below market expectations of 3.62 billion but also represented a rare quarter-over-quarter decline.
Can Meta Rise to $1,000 This Year?
Based on Meta's foreseeable development, it will be difficult for Meta's stock price to rise to $1,000 by the end of the year. With hardware investments reaching over $130 billion for the full year of 2026, its massive depreciation expenses will rigidly erode net profit in the second half of the year. Analysts estimate that Meta's profit margin in 2026 will decline slightly from its 2025 peak (to approximately 31.9%), making it difficult in the short term to support an aggressive expansion of its P/E ratio to over 30 times. Currently, Meta's P/E ratio is around 22 times, which already offers excellent value among tech giants.
Currently, the market consensus 12-month target price for Meta is around $800 to $840, which means there is an opportunity in the second half of the year to retest and surpass the all-time high set at the beginning of the year. TD Cowen and Wolfe Research have target prices of $800, while BofA Securities and Truist Securities expect the stock to rise to $835 and $840, respectively.
From a technical analysis perspective, Meta's stock price trended in a symmetrical triangle in the first half of the year, implying an equal probability of an upward or downward move. However, considering the macroeconomic environment and Meta's own fundamentals, a downward breakdown is more likely, which could drag the price down to $400. Currently, Meta is approaching the apex of the triangle and is expected to experience a breakout by the end of this month, with the earnings release on July 29 being a key focus.
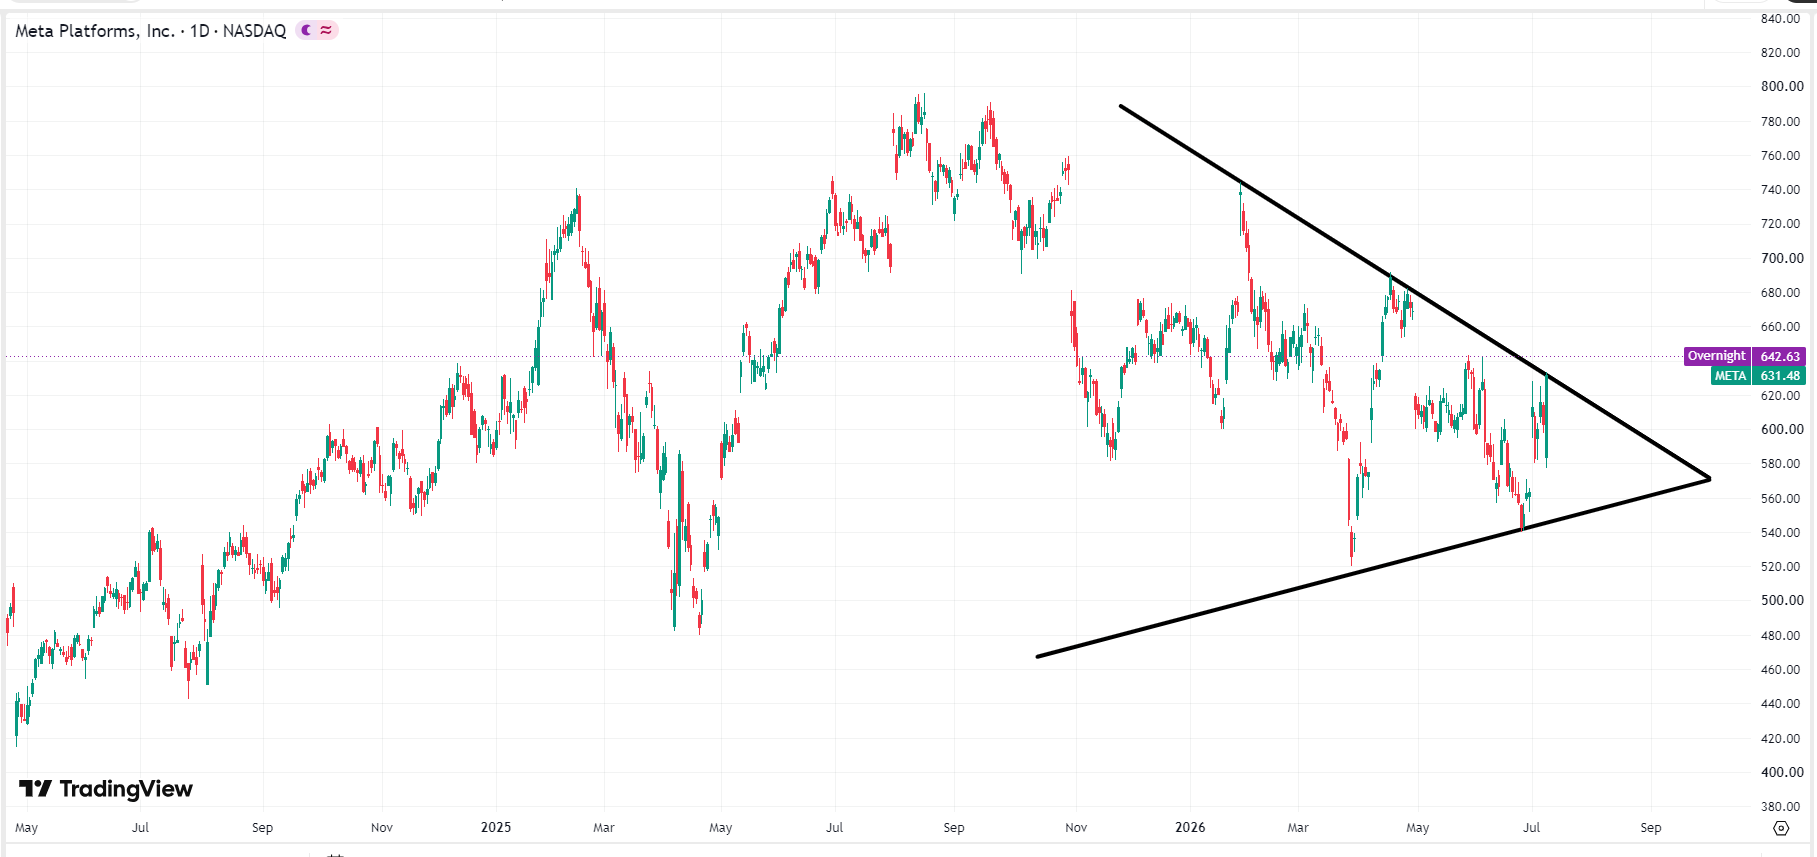 Meta Stock Price Chart, Source: TradingView
Why could the stock price rise to $1,000 if the P/E ratio exceeds 30 times?
With the current stock price at over $600, the market estimates its 2026 annual EPS to fall between $31 and $33. Based on the maximum EPS calculation, stock price = $33 * 30x (P/E) = $990, and a calculation exceeding 30 times could result in a price reaching $1,000.
Why is $400 the downside target for Meta?
$400 was the peak of Meta's rebound in 2021 and also the starting point of its upward surge over the past three years, meaning this level provides highly robust support.
Recommended Articles


