

Treasury Yields Just Fell by the Fastest Rate in 5 Months. What Comes Next?
Key Points
Throughout 2026, the market rotation has mostly stayed within U.S. equities.
Over the past couple of weeks, signs have emerged that money is moving out of stocks and into bonds.
If this trend continues, it could be a bad sign for investors and signal a more vulnerable market ahead.
- These 10 stocks could mint the next wave of millionaires ›
Throughout the recent market cycle, there has been some peculiar behavior in the relationship between stocks and bonds. Historically, stocks and bonds often move in opposite directions. As one of these asset classes is in favor, the other usually lags.
Over the past three years, that hasn't been the case. Since the beginning of 2023, the S&P 500 has pretty consistently moved higher. But long-term Treasury yields have remained largely flat over the period.
Where to invest $1,000 right now? Our analyst team just revealed what they believe are the 10 best stocks to buy right now, when you join Stock Advisor. See the stocks »
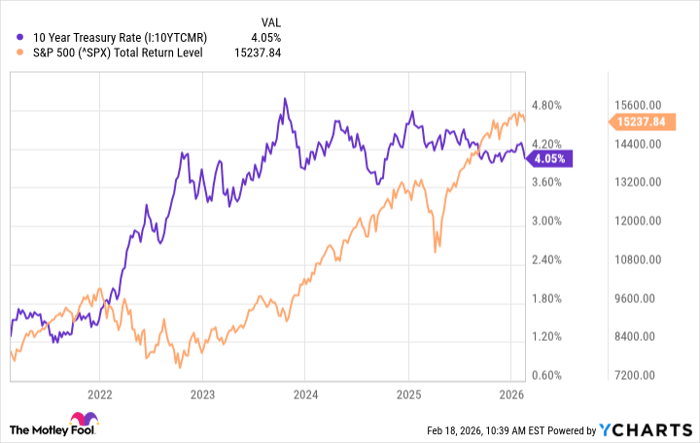
10 Year Treasury Rate data by YCharts
A couple of factors can help explain this:
- While inflation has declined significantly from its 2022 peak, it's still above the Federal Reserve's long-term target. Higher inflation tends to lead to higher interest rates.
- Government debt continues to soar. With more supply hitting the market, the rate paid on the debt needs to be higher to get investors to buy it.
- This dynamic has helped drive investors to gold to address market and currency risk instead of Treasuries.
The equity market has also seen a major rotation out of tech and growth stocks. This behavior of Treasury yields leads me to believe that the money coming out of tech is flowing into other areas of the equity market. We see this in the year-to-date returns in defensive, value, low-volatility, and small-cap stocks.

Image source: Getty Images.
In other words, the stagnant returns of long-term Treasuries suggest that this is a stocks-to-stocks rotation, not a stocks-to-bonds one.
Now that may be changing.
Treasury yields are dropping
Earlier this month, the 10-year Treasury yield dropped by roughly 25 basis points from peak to valley over a seven-day period. That's the sharpest decline in this yield over a seven-day period since September.
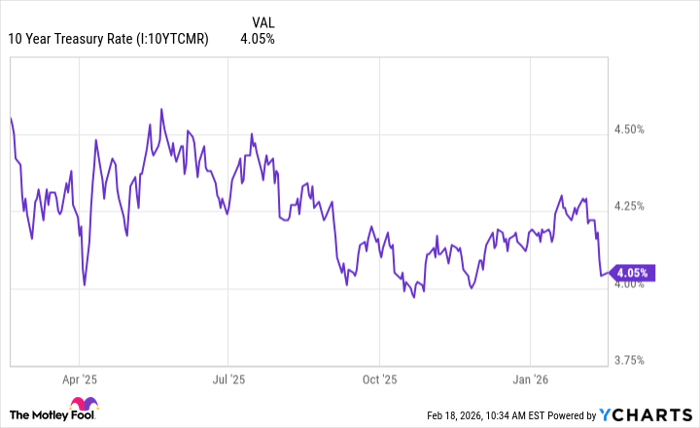
10 Year Treasury Rate data by YCharts
Granted, seven days is an arbitrary measurement period. And, as you can see from the chart above, the 10-year yield is still within the range it's been in for several months.
But it also can't be ignored. Sudden declines like this typically only occur during negative sentiment shifts. Whether that sentiment change sticks is very situation-dependent, but I don't think we can discount the fact that investors got a little spooked here. This is confirmed by the uptick in volatility we saw at the same time.
Some will argue that the move in yields was a result of the lower-than-expected inflation print we saw in January. I get that, but I think there was too much movement elsewhere in the market consistent with a risk-off move than could be accounted for just by an inflation report.
In summary, this has the look of the stocks-to-bonds move that could signal a broader risk-off environment ahead. Investors would be wise to keep an eye on the direction of rates and volatility here to see if this was a one-off move or a catalyst for a more vulnerable market ahead.
Where to invest $1,000 right now
When our analyst team has a stock tip, it can pay to listen. After all, Stock Advisor’s total average return is 904%* — a market-crushing outperformance compared to 194% for the S&P 500.
They just revealed what they believe are the 10 best stocks for investors to buy right now, available when you join Stock Advisor.
See the stocks »
*Stock Advisor returns as of February 24, 2026.
The Motley Fool has a disclosure policy.
Recommended Articles


