

Top 3 Price Prediction: Bitcoin, Ethereum, Ripple – BTC, ETH and XRP face downside risk as bears regain control 

Mitrade
coverImg
Source: DepositPhotos
  • Bitcoin continues to edge lower on Wednesday, extending consolidation in a trading range for over 11 days.

  • Etherum trades sideways between $1,700 and $2,150, signaling indecision among traders.

  • XRP hovers at $1.47, finding support at the lower trendline boundary, close below suggests a correction ahead.

Bitcoin (BTC), Ethereum (ETH), and Ripple (XRP) remain under pressure on Wednesday, with the broader trend still sideways. BTC is edging below $68,000, nearing the lower consolidating boundary, while ETH and XRP also declined slightly, approaching their key supports. The price action of the top three cryptocurrencies could face downside risk as bears regain control of momentum.

Bitcoin could extend the fall if it closes below the lower consolidation boundary

Bitcoin price has been consolidating in a range between $65,729 and $71,746 since February 7. BTC declined 2% so far this week and, as of Wednesday, is trading below $68,000, approaching the lower consolidation boundary.

If BTC closes below the lower consolidation level at $65,729, it could extend the decline toward the key support level at $60,000.

The Relative Strength Index (RSI) on the daily chart reads 34, below the neutral level of 50 and pointing downward toward the oversold levels, indicating bearish momentum gaining traction. However, the Moving Average Convergence Divergence (MACD) showed a bullish crossover on Sunday, which remains in place, suggesting that upside bias has not been invalidated yet.
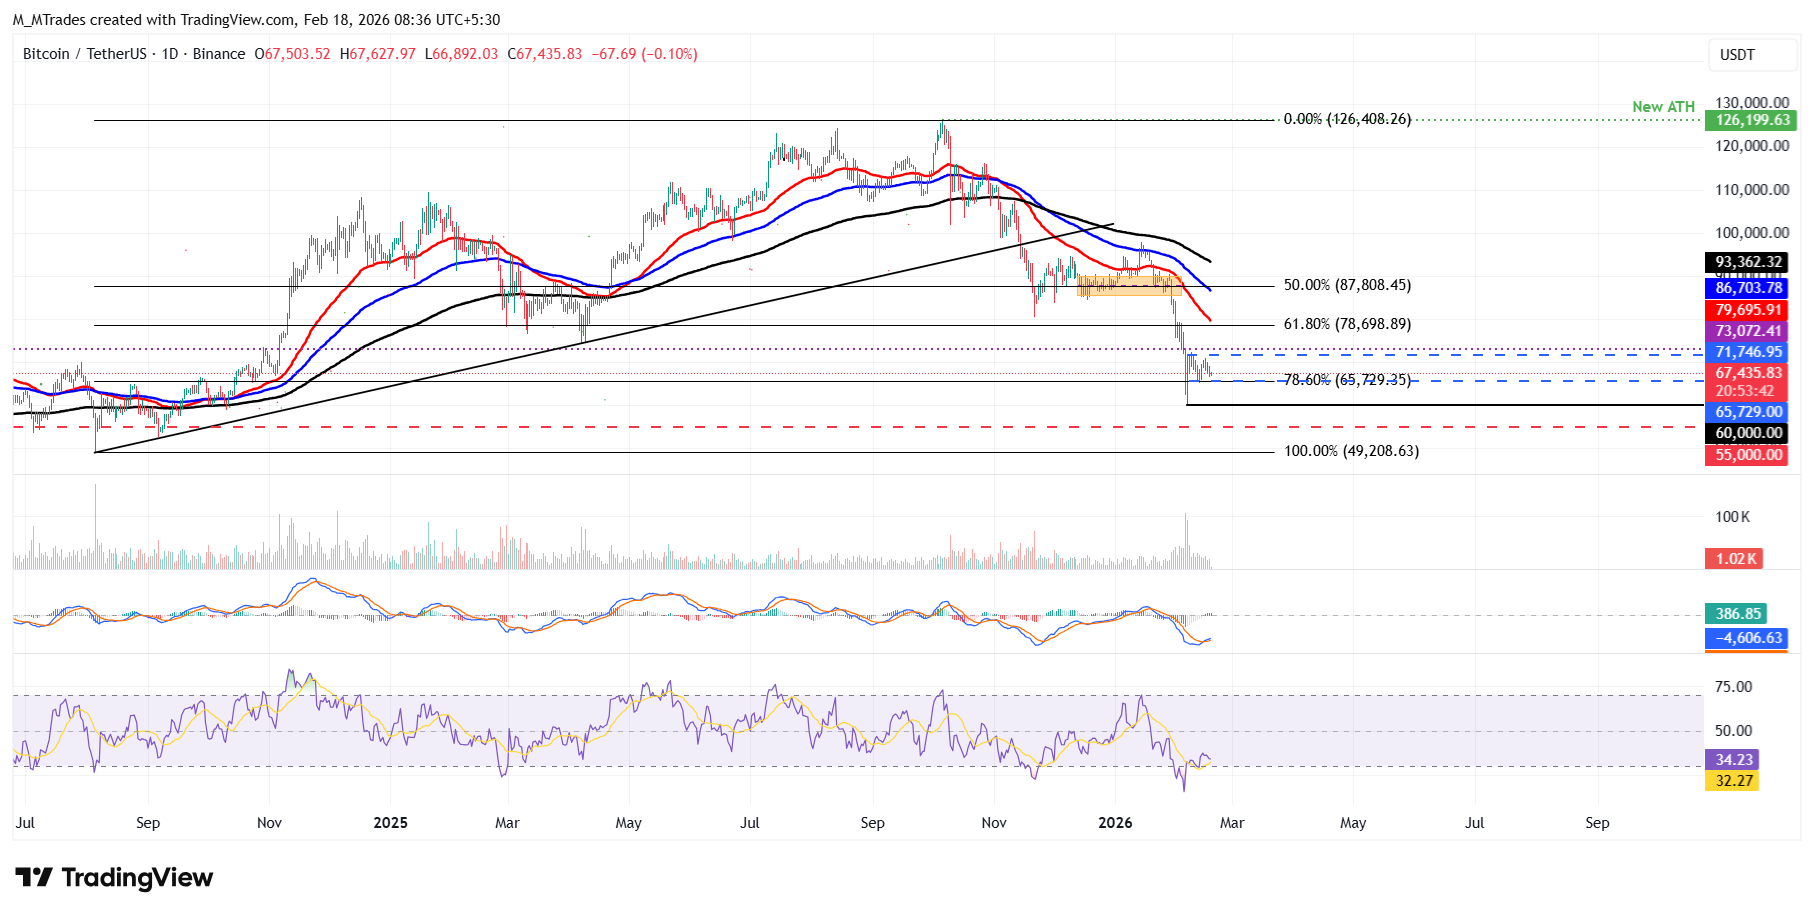
On the other hand, if BTC breaks above the upper consolidation range at $71,746, it could extend the recovery toward the daily resistance at $73,072.

Ethereum declines after revisiting its key resistance zone

Ethereum price was rejected near the upper consolidation range at $2,149 on Sunday and declined by 5.75% that day. ETH has been hovering around the $2,000 level for the past two days and, as of Wednesday, remains there.

If ETH experiences a correction, it could extend to the lower consolidation range at $1,747.

Like Bitcoin, Ethereum’s RSI shows bearish momentum gaining traction. At the same time, the MACD indicator printed a bullish crossover on Saturday that remains intact, suggesting the broader upside bias has not yet been invalidated.
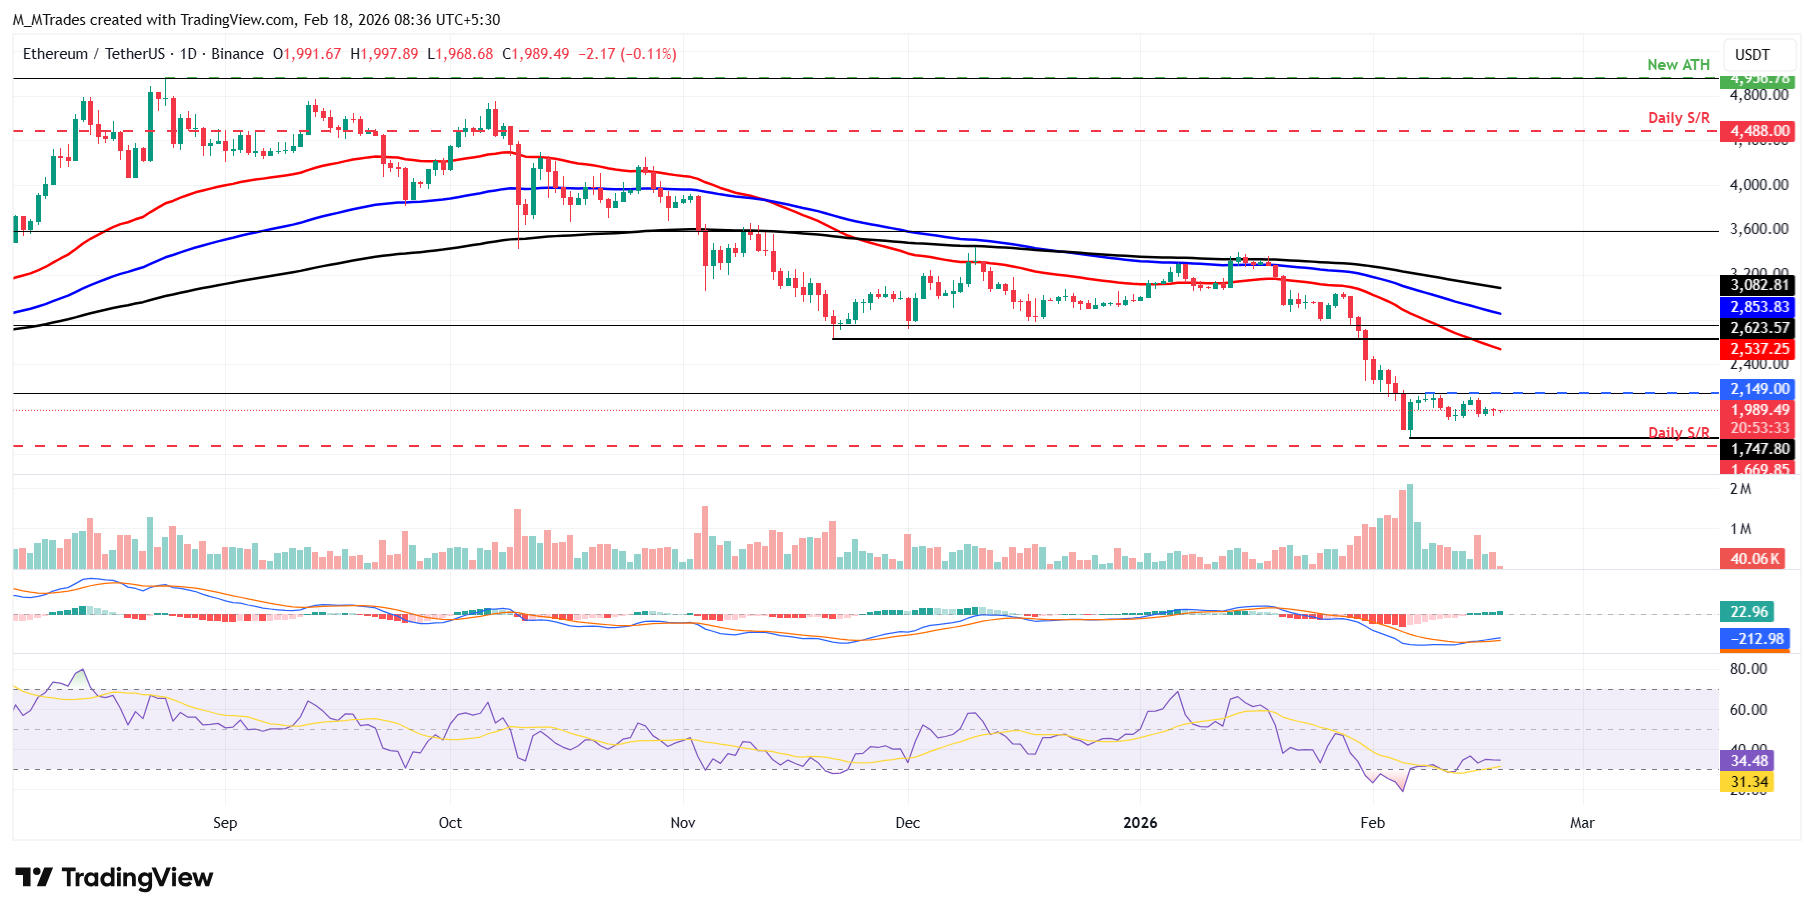
However, if ETH closes above the upper consolidation range at $2,149, it could extend the recovery toward the next key resistance at $2,400.

XRP finds support around the lower trendline boundary

XRP broke above the lower trendline boundary of a falling wedge on Saturday and declined slightly the next day, finding support around it. XRP has stabilized around this trendline so far this week. As of Wednesday, XRP trades at $1.47.

If XRP slips and closes below the lower trendline, it could extend the decline toward the weekly support at $1.30.

Like Bitcoin and Ethereum, XRP’s momentum indicators remain conflicted, with RSI pointing to building bearish pressure while the MACD continues to signal underlying bullish momentum.
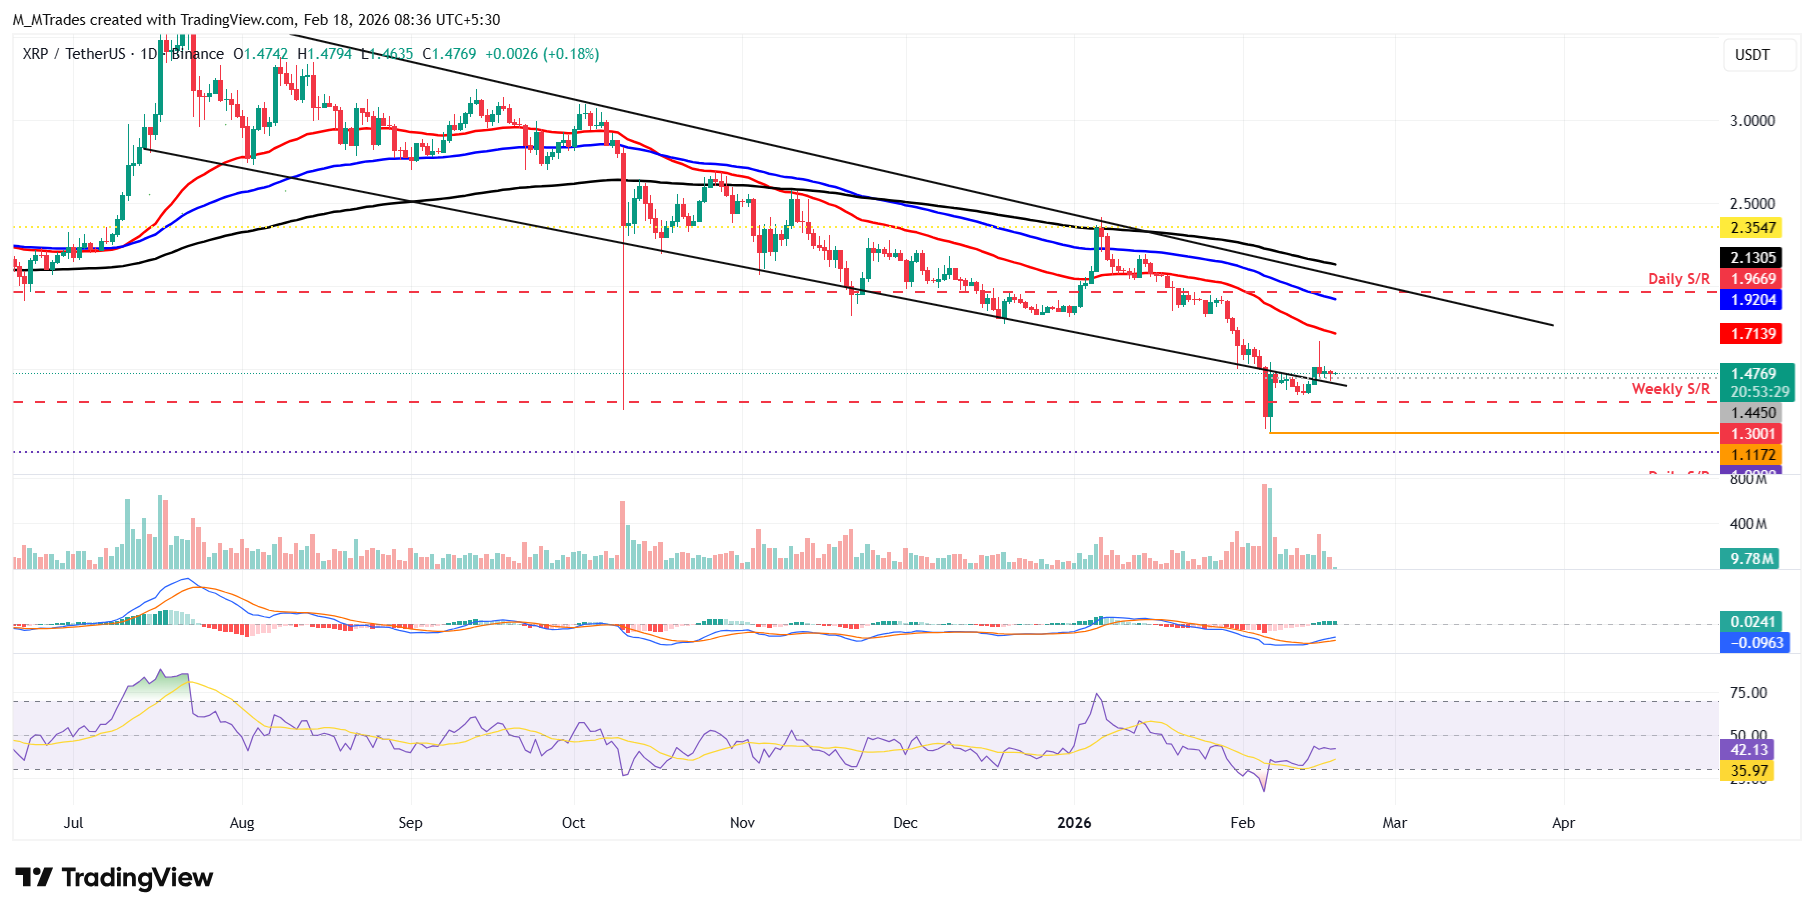
Conversely, if the lower trendline boundary holds as support, it could extend the recovery toward the 50-day Exponential Moving Average (EMA) at $1.71.

Read more

  • Gold Price Forecast: Gold Tumbles Below $3,900 as Trump Says No Need for Iran Deal; Can October PPI Spur a Rebound?
  • * The content presented above, whether from a third party or not, is considered as general advice only.  This article should not be construed as containing investment advice, investment recommendations, an offer of or solicitation for any transactions in financial instruments.

    goTop
    quote
    Related Articles
    placeholder
    Bitcoin lost its 200-day average — but the exit started three sessions before the CPIBitcoin fell 2.5% to about $73,400 on 11 November, an 11-week low, breaking its 200-day moving average near $73,100. The 24-hour liquidation tally reached $632 to $705 million, roughly 82% of it longs. But spot ETF outflows began three sessions earlier and USDT's market cap has shrunk $6.6 billion in 60 days — the leveraged length left before the inflation print did. A double top at 81,890 and 81,080 leaves a measured target of 69,366.
    Author  Suzie
    Nov 11, Wed
    Bitcoin fell 2.5% to about $73,400 on 11 November, an 11-week low, breaking its 200-day moving average near $73,100. The 24-hour liquidation tally reached $632 to $705 million, roughly 82% of it longs. But spot ETF outflows began three sessions earlier and USDT's market cap has shrunk $6.6 billion in 60 days — the leveraged length left before the inflation print did. A double top at 81,890 and 81,080 leaves a measured target of 69,366.
    placeholder
    Bitcoin ETFs sold $1.28 billion in a week — and BTC is still above 75,000US spot Bitcoin ETFs logged $1.28 billion of net outflows in the week to Nov 6, the largest since late June, with BlackRock's IBIT accounting for $1.21 billion. Yet BTC only fell from $80,405 to $74,940, a 6.8% move. The gap between the fund flow and the price is the story: leveraged longs were flushed, but spot holders did not follow the ETFs out — and $75,000 is the line that decides whether that reading holds.
    Author  Suzie
    Nov 09, Mon
    US spot Bitcoin ETFs logged $1.28 billion of net outflows in the week to Nov 6, the largest since late June, with BlackRock's IBIT accounting for $1.21 billion. Yet BTC only fell from $80,405 to $74,940, a 6.8% move. The gap between the fund flow and the price is the story: leveraged longs were flushed, but spot holders did not follow the ETFs out — and $75,000 is the line that decides whether that reading holds.
    placeholder
    Binance replaced 95% of a $6.3bn hole — Bitcoin is trading the plumbing, not the coinBinance resumed withdrawals on November 1 after a record $6.3bn theft. In the first 9.5 hours, users withdrew $4.64bn and deposited $1.01bn, a net outflow of $3.64bn, or 2.1% of assets. Bitcoin fell to 76,173 and is now 78,473. The market is pricing the exchange, not the supply.
    Author  Suzie
    Nov 02, Mon
    Binance resumed withdrawals on November 1 after a record $6.3bn theft. In the first 9.5 hours, users withdrew $4.64bn and deposited $1.01bn, a net outflow of $3.64bn, or 2.1% of assets. Bitcoin fell to 76,173 and is now 78,473. The market is pricing the exchange, not the supply.
    placeholder
    Bitcoin is back above $80,000 — but 75% of the bounce was shorts, not buyersBitcoin trades at $80,669, back above the $80,000 line after touching $79,145 on October 24. But 75.4% of the last 24 hours of futures liquidations were shorts, CME open interest fell 36,545 BTC in October, and spot ETFs lost $773.5 million on October 22-23. Price is up; positioning is down. Here is why the bounce is a squeeze, and the four things that would make it real.
    Author  Suzie
    Oct 28, Wed
    Bitcoin trades at $80,669, back above the $80,000 line after touching $79,145 on October 24. But 75.4% of the last 24 hours of futures liquidations were shorts, CME open interest fell 36,545 BTC in October, and spot ETFs lost $773.5 million on October 22-23. Price is up; positioning is down. Here is why the bounce is a squeeze, and the four things that would make it real.
    placeholder
    Bitcoin's double top at $88,000: why $78,000 is the line that decides the next moveBitcoin trades near $82,500 (+0.47%) after twice failing at the $88,000 area, forming a potential double top with a neckline at $78,000. A break below the neckline would project a measured target near $68,200; a close back above $88,000 would invalidate the pattern. Here are the structure, the levels and what would confirm either side.
    Author  Suzie
    Oct 19, Mon
    Bitcoin trades near $82,500 (+0.47%) after twice failing at the $88,000 area, forming a potential double top with a neckline at $78,000. A break below the neckline would project a measured target near $68,200; a close back above $88,000 would invalidate the pattern. Here are the structure, the levels and what would confirm either side.
    Live Quotes
    Name / SymbolChart% Change / Price
    BTCUSD
    BTCUSD
    0.00%0.00
    ETHUSD
    ETHUSD
    0.00%0.00
    XRPUSD
    XRPUSD
    0.00%0.00

    Bitcoin Related Articles

    • Bitcoin Leverage And Margin Trading in 2026: The Ultimate Beginner's Guide
    • Gold vs Bitcoin 2026: Which Is the Better Investment?Best Hedge Asset Comparison
    • Best Strategies When BTC Price Drops: From Hedging to Accumulating
    • How to Day Trade Crypto? Simplest Day Trading Strategy Ever
    • Bitcoin Price Prediction 2026-2030: Long-Term Outlook Driven by Data & Macro Cycles
    • Bitcoin Mining Beginner Guide: What Is Bitcoin Mining and How to Mine Bitcoin?

    Click to view more