
The Best Dividend ETF to Buy: SCHD Pays a High Yield While VIG Focuses on Dividend Growth
Key Points
The Vanguard Dividend Appreciation ETF and the Schwab U.S. Dividend Equity ETF Income are among the top dividend ETFs to earn years of passive income.
SCHD offers a much higher dividend yield but trails VIG in recent total returns.
VIG has broader diversification with over three times as many holdings and focuses on dividend growth.
- These 10 stocks could mint the next wave of millionaires ›
The Vanguard Dividend Appreciation ETF (NYSEMKT:VIG) and the Schwab U.S. Dividend Equity ETF (NYSEMKT:SCHD) are both dividend-focused exchange-traded funds (ETFs), targeting U.S. companies with a strong record of paying dividends. Their approaches and sector exposures, however, diverge meaningfully in terms of yield, sector tilt, and portfolio breadth, with VIG offering wider diversification and SCHD providing a higher income payout.
The comparison below breaks down how these funds stack up on cost, performance, risk, and portfolio construction to help investors decide which may better fit their goals.
Snapshot (cost & size)
| Metric | VIG | SCHD |
|---|---|---|
| Issuer | Vanguard | Schwab |
| Expense ratio | 0.05% | 0.06% |
| 1-yr total return (as of Dec. 19, 2025) | 14.9% | 6% |
| Dividend yield | 1.6% | 3.8% |
| Beta | 0.79 | 0.73 |
| AUM | $120.4 billion | $72.5 billion |
Beta measures price volatility relative to the S&P 500; beta is calculated from five-year weekly returns. The 1-yr return represents total return over the trailing 12 months.
Both funds are low-cost, with SCHD charging just a hair more, but SCHD stands out for its much higher dividend yield and could potentially appeal to those prioritizing income over recent total returns.
Performance & risk comparison
| Metric | VIG | SCHD |
|---|---|---|
| Max drawdown (5 y) | (20.4%) | (16.8%) |
| Growth of $1,000 over 5 years (in terms of total returns) | $1,721 | $1,530 |
What's inside
The Schwab U.S. Dividend Equity ETF holds a 14.2-year track record. The ETF tracks the Dow Jones U.S. Dividend 100 Index, focusing on 103 high-yielding, high-quality U.S. stocks. Its sector mix is heavily weighted towards energy (19.3%), consumer defensive (18.5%), and healthcare (16.1%). Top holdings include Merck & Co (NYSE:MRK), Amgen (NASDAQ:AMGN), and Cisco Systems (NASDAQ:CSCO). This concentrated approach may appeal to those seeking a targeted, income-oriented portfolio.
The Vanguard Dividend Appreciation ETF tracks the S&P U.S. Dividend Growers Index, which comprises stocks that have raised their dividends for at least 10 consecutive years. It's a vast portfolio of 338 stocks, with an emphasis on large-cap firms that have a consistent history of dividend growth. Its sector exposure is tilted toward technology (27.8%), financial services (21.4%), and healthcare (16.7%), with major positions in Broadcom (NASDAQ:AVGO), Microsoft (NASDAQ:MSFT), and Apple (NASDAQ:AAPL). The broader diversification and tech tilt may attract growth-minded investors.
For more guidance on ETF investing, check out the full guide at this link.
What this means for investors
Investing in dividend ETFs is an easy and low-cost way to generate passive income for years without the need and expertise to analyze and buy individual stocks. The Vanguard Dividend Appreciation ETF and the Schwab U.S. Dividend Equity ETF are among the top dividend ETFs out there, with both focusing on stocks that pay highly reliable and sustainable dividends.
SCHD's dividend yield of 3.8% is more than twice that of VIG's. That's because the SCHD fund focuses on high-yield dividend stocks, but they are also all consistent dividend payers. That filters out companies that pay a high yield but may not be able to support it. Most of its top holdings offer yields of 3% or higher.
VIG, in contrast, is less about yields and more about dividend growth. The underlying index fund (the S&P U.S. Dividend Growers Index) defaults to excluding the top 25% highest-yielding companies to remove potentially unstable dividend-paying companies. Instead, VIG includes only companies with at least a 10-year continuous streak of dividend increases.
Here's the most interest part. Income investors often base their decisions on yield. However, VIG is proof of how dividend growth stocks, with reinvested dividends, can often outperform even high-yielding stocks in the long term.
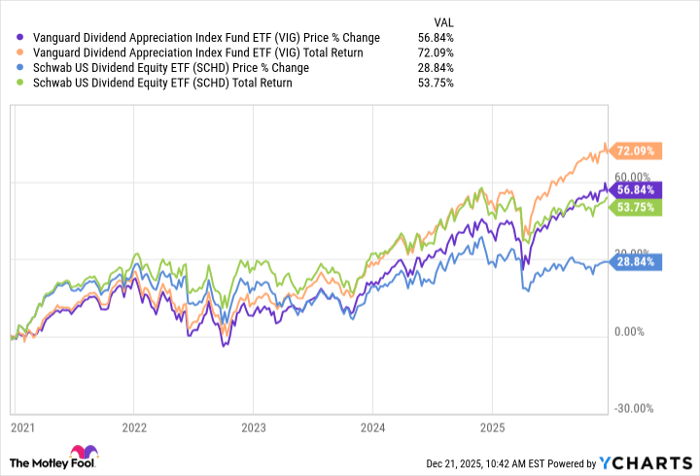
VIG data by YCharts
To be fair, VIG's significantly larger portfolio also contributes to its total returns. Overall, investors seeking more stable and bankable dividends that also grow year after year may prefer VIG over SCHD.
Glossary
Dividend yield: Annual dividends paid by a fund or stock divided by its current price, shown as a percentage.
Expense ratio: Annual fee, expressed as a percentage of assets, that a fund charges to cover operating costs.
Beta: A measure of an investment’s volatility compared to the overall market, typically the S&P 500.
Max drawdown: The largest percentage drop from a fund’s peak value to its lowest point over a specific period.
Asset under management (AUM): Total market value of assets that an investment fund manages on behalf of investors.
Sector tilt: When a fund has greater exposure to certain industries or sectors compared to the broader market.
Dividend growth: The consistent increase in dividend payments by a company or fund over time.
Large-cap: Companies with a large total market value, generally over $10 billion in market capitalization.
Index: A benchmark that tracks the performance of a group of securities, often used as a reference for funds.
Portfolio construction: The process of selecting and weighting assets within a fund to achieve specific investment goals.
Total return: The investment's price change plus all dividends and distributions, assuming those payouts are reinvested.
Drawdown: The decline in value from a fund’s highest point to its lowest before a new peak is reached.
Where to invest $1,000 right now
When our analyst team has a stock tip, it can pay to listen. After all, Stock Advisor’s total average return is 972%* — a market-crushing outperformance compared to 193% for the S&P 500.
They just revealed what they believe are the 10 best stocks for investors to buy right now, available when you join Stock Advisor.
See the stocks »
*Stock Advisor returns as of December 21, 2025.
Neha Chamaria has no position in any of the stocks mentioned. The Motley Fool has positions in and recommends Amgen, Apple, Cisco Systems, Merck, Microsoft, and Vanguard Dividend Appreciation ETF. The Motley Fool recommends Broadcom and recommends the following options: long January 2026 $395 calls on Microsoft and short January 2026 $405 calls on Microsoft. The Motley Fool has a disclosure policy.
Recommended Articles


