Better Buy in 2026: Novo Nordisk or Intuitive Surgical?

Source The Motley Fool

Key Points

  • Novo Nordisk's new indications for semaglutide and its attractive pipeline could allow it to bounce back.

  • Intuitive Surgical should remain the leader in its niche despite increased competition.

  • Both stocks could be long-term winners, and the choice today might depend on risk tolerance.

  • 10 stocks we like better than Novo Nordisk ›

Novo Nordisk (NYSE: NVO) and Intuitive Surgical (NASDAQ: ISRG) are both healthcare leaders, but they operate in different corners of this vast sector. The former markets pharmaceutical drugs, while the latter develops and sells robotic-assisted surgery (RAS) devices, with its da Vinci system being the leader in its category.

They do have one thing in common, though: Novo Nordisk and Intuitive Surgical have both faced challenges this year that have led to below-average stock-market performances. They could also bounce back next year. But which one is the better option heading into 2026? Let's find out.

Where to invest $1,000 right now? Our analyst team just revealed what they believe are the 10 best stocks to buy right now, when you join Stock Advisor. See the stocks »

Surgeons performing an operation.

Image source: Getty Images.

1. Novo Nordisk has a lot riding on its pipeline

Novo Nordisk's financial results haven't matched investors' expectations this year. Top-line growth declined, and the company was forced to lower its outlook as it lost ground in the all-important GLP-1 market for weight loss and diabetes medications, where it generates almost all of its revenue. However, several things could help Novo Nordisk bounce back and perform well over the next five years.

First, it should launch brand-new products. While CagriSema didn't quite meet management's target of a mean weight loss of 25% in a phase 3 study, the 22.7% its record is still highly competitive. This medication could help Novo Nordisk navigate an increasingly crowded GLP-1 market. The company should also make progress with other late-stage candidates, including amycretin, which is being investigated in type 2 diabetes and weight loss. Newer products will help boost sales growth.

In the meantime, Novo Nordisk will benefit from recent (and pending) label expansions for its most important compound, semaglutide. It has earned new approvals in the U.S. and Europe for helping reduce the risk of major cardiovascular events, and for treating patients with metabolic dysfunction-associated steatohepatitis (MASH), an area with a high unmet need.

The company could also see more regulatory nods soon for an oral version of semaglutide in weight loss, and for a higher dose of the medicine, which induced even stronger weight loss in clinical trials.

Even if they've fallen short of expectations, Novo Nordisk's financial results haven't been terrible. Through the first nine months of the year, sales jumped 12% year over year to 229.9 billion Danish kroner ($36.2 billion). Net profit climbed 4% year over year to 75.5 billion DKK ($11.9 billion).

And as new indications and approvals roll in, these results could improve and allow Novo Nordisk's stock to bounce back.

Can Intuitive Surgical protect its market share?

Intuitive Surgical is the undisputed top player in the RAS market. However, it's now facing competition like never before. Medtronic, another medical device maker, has earned clearance for its Hugo system in urologic procedures, a market where Intuitive's da Vinci system is also used.

But this issue will hardly sink Intuitive Surgical's prospects. The da Vinci system is approved across many more uses than just urologic procedures. It will take a while for any single company -- or even more than one -- to challenge Intuitive Surgical's dominance in every corner of the vast number of indications its product is used in. And throughout it all, the company should maintain its lead.

The da Vinci system has been on the market for more than 20 years and has generated a substantial amount of clinical data from real-world use, which helps inform changes based on feedback from surgeons. Intuitive Surgical launched the fifth generation of its device last year, and it's already seeing significant success thanks to several innovative features, including Force Feedback technology. This allows physicians to feel the pressure they are applying to patients' body tissues during procedures and make adjustments as needed, thereby avoiding significant damage.

The RAS market is also underpenetrated. As Medtronic pointed out a few years ago, fewer than 5% of eligible procedures are performed robotically. So there should be a vast addressable market for Intuitive Surgical, even with potential competition from new market entrants.

Meanwhile, its financial results remain strong. Third-quarter revenue grew 23% year over year to $2.51 billion, while adjusted net income increased about 30% to $867 million.

With a solid economic moat, a vast growth runway, and long-term tailwinds like the aging of the world's population, Intuitive Surgical's future still looks bright.

Which is the better buy?

One argument against Novo Nordisk is that its only growth driver has lost momentum. Even with label expansions for semaglutide, the competition will remain fierce. By contrast, Intuitive Surgical's core market, even with new launches in RAS, remains stable given its extensive list of indications and large installed base.

There's also an argument in Novo Nordisk's favor. It generates higher revenue and earnings, has comparable profit margins, and looks more reasonably valued:

NVO Revenue (Quarterly) Chart

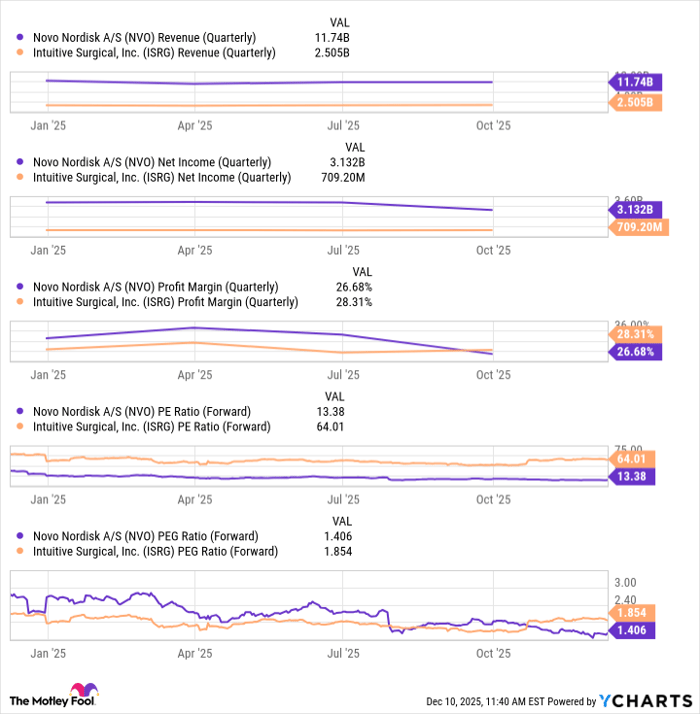
NVO Revenue (Quarterly) data by YCharts.

Intuitive Surgical's higher valuation makes sense -- for the foreseeable future, its top and bottom lines should grow faster. However, its shares could also be more volatile.

So, which stock should you choose? My view is that both could generate strong returns over the long run, and the choice today depends on your investment style. Value investors seeking dividend payers at a bargain should opt for Novo Nordisk. Those seeking aggressive growth potential should consider buying Intuitive Surgical's shares.

Should you buy stock in Novo Nordisk right now?

Before you buy stock in Novo Nordisk, consider this:

The Motley Fool Stock Advisor analyst team just identified what they believe are the 10 best stocks for investors to buy now… and Novo Nordisk wasn’t one of them. The 10 stocks that made the cut could produce monster returns in the coming years.

Consider when Netflix made this list on December 17, 2004... if you invested $1,000 at the time of our recommendation, you’d have $509,955!* Or when Nvidia made this list on April 15, 2005... if you invested $1,000 at the time of our recommendation, you’d have $1,089,460!*

Now, it’s worth noting Stock Advisor’s total average return is 968% — a market-crushing outperformance compared to 193% for the S&P 500. Don't miss the latest top 10 list, available with Stock Advisor, and join an investing community built by individual investors for individual investors.

See the 10 stocks »

*Stock Advisor returns as of December 18, 2025.

Prosper Junior Bakiny has positions in Intuitive Surgical and Novo Nordisk. The Motley Fool has positions in and recommends Intuitive Surgical. The Motley Fool recommends Medtronic and Novo Nordisk and recommends the following options: long January 2026 $75 calls on Medtronic and short January 2026 $85 calls on Medtronic. The Motley Fool has a disclosure policy.

Disclaimer: For information purposes only. Past performance is not indicative of future results.
placeholder
Ethereum Price Slips Lower — $3,000 Looms as the Key BattlegroundEthereum is attempting to recover from a $3,026 low but remains below $3,200 and the 100-hour SMA, with a bearish trend line near $3,175 capping rebounds as bulls need a clean break above $3,200 to target $3,250–$3,400, while a drop below $3,050 risks a retest of $3,000 and $2,940.
Author  Mitrade
Dec 15, Mon
Ethereum is attempting to recover from a $3,026 low but remains below $3,200 and the 100-hour SMA, with a bearish trend line near $3,175 capping rebounds as bulls need a clean break above $3,200 to target $3,250–$3,400, while a drop below $3,050 risks a retest of $3,000 and $2,940.
placeholder
Bitcoin Slides 5% as Sellers Lean In — Can BTC Reclaim $88,000?Bitcoin has dropped back below $88,000 after rolling over from $90,500, with price still trading under the 100-hour Simple Moving Average. The sell-off found a floor at $85,151, and BTC is now consolidating near that base, but rebounds are facing pressure from a bearish trend line around $89,000. Bulls need to retake $88,000–$89,000 to ease downside risk; failure to do so keeps $85,500–$85,000 and then $83,500 in play, with $80,000 as the deeper “line in the sand.” Bitcoin (BTC) is back in damage-control mode after a sharp pullback wiped out recent gains. The price failed to reclaim the $90,000–$90,500 band, rolled over, and slid through $88,500 before briefly dipping under $87,000. Buyers did show up around $85,000, but the rebound so far looks more like stabilization than a clear trend reversal. Bitcoin dips hard, finds a bid near $85,000(h3) BTC’s latest move lower began when it couldn’t build follow-through above $90,000 and $90,500. Once that upside stalled, sellers took control and pushed price down through $88,500. The slide accelerated enough to spike below $87,000, but the market didn’t free-fall. Bulls defended the $85,000 zone, printing a low at $85,151. Since then, Bitcoin has been consolidating below the 23.6% Fibonacci retracement of the drop from the $93,560 swing high to the $85,151 low — a clue that the bounce is still shallow and that sellers haven’t fully backed off yet. Structurally, BTC is still on the back foot: It’s trading below $88,000, and It remains below the 100-hour Simple Moving Average, keeping short-term trend pressure pointed downward. Resistance is layered, and $89,000 is the problem area(h3) If bulls try to turn this into a recovery, they’ll have to climb through multiple ceilings in quick succession. First, BTC faces resistance around $87,150, followed by a more meaningful barrier near $87,500. From there, the market’s attention snaps back to $88,000 — the level BTC just lost and now needs to reclaim. A close back above $88,000 would improve the tone, but it doesn’t solve the bigger issue: there’s a bearish trend line on the hourly BTC/USD chart (Kraken feed) with resistance near $89,000, which also lines up with the next technical hurdle. If BTC can push through $89,000 and hold, the rebound could extend toward $90,000, with follow-through targets at $91,000 and $91,500. But until price clears that $88,000–$89,000 zone, rallies are at risk of being sold rather than chased. If BTC fails to reclaim resistance, the downside path is clear(h3) The near-term bear case is simple: if Bitcoin can’t climb back above the $87,000 area and keep traction, sellers may attempt another leg lower. Support levels line up like this: Immediate support: $85,500 First major support: $85,000 Next support: $83,500 Then $82,500 in the near term Below that, the major “don’t break this” level is still $80,000. If BTC slips under $80,000, the risk of acceleration to the downside increases significantly — not because it’s magic, but because it’s the kind of psychological and structural level that tends to trigger forced de-risking. Indicators: momentum still leans bearish(h3) The intraday indicators aren’t offering much comfort yet: Hourly MACD is losing pace in the bearish zone. Hourly RSI remains below 50, suggesting sellers still have the upper hand on short timeframes. So while the $85,000 defense held for now, the market hasn’t flipped bullish — it’s just stopped bleeding.
Author  Mitrade
Dec 16, Tue
Bitcoin has dropped back below $88,000 after rolling over from $90,500, with price still trading under the 100-hour Simple Moving Average. The sell-off found a floor at $85,151, and BTC is now consolidating near that base, but rebounds are facing pressure from a bearish trend line around $89,000. Bulls need to retake $88,000–$89,000 to ease downside risk; failure to do so keeps $85,500–$85,000 and then $83,500 in play, with $80,000 as the deeper “line in the sand.” Bitcoin (BTC) is back in damage-control mode after a sharp pullback wiped out recent gains. The price failed to reclaim the $90,000–$90,500 band, rolled over, and slid through $88,500 before briefly dipping under $87,000. Buyers did show up around $85,000, but the rebound so far looks more like stabilization than a clear trend reversal. Bitcoin dips hard, finds a bid near $85,000(h3) BTC’s latest move lower began when it couldn’t build follow-through above $90,000 and $90,500. Once that upside stalled, sellers took control and pushed price down through $88,500. The slide accelerated enough to spike below $87,000, but the market didn’t free-fall. Bulls defended the $85,000 zone, printing a low at $85,151. Since then, Bitcoin has been consolidating below the 23.6% Fibonacci retracement of the drop from the $93,560 swing high to the $85,151 low — a clue that the bounce is still shallow and that sellers haven’t fully backed off yet. Structurally, BTC is still on the back foot: It’s trading below $88,000, and It remains below the 100-hour Simple Moving Average, keeping short-term trend pressure pointed downward. Resistance is layered, and $89,000 is the problem area(h3) If bulls try to turn this into a recovery, they’ll have to climb through multiple ceilings in quick succession. First, BTC faces resistance around $87,150, followed by a more meaningful barrier near $87,500. From there, the market’s attention snaps back to $88,000 — the level BTC just lost and now needs to reclaim. A close back above $88,000 would improve the tone, but it doesn’t solve the bigger issue: there’s a bearish trend line on the hourly BTC/USD chart (Kraken feed) with resistance near $89,000, which also lines up with the next technical hurdle. If BTC can push through $89,000 and hold, the rebound could extend toward $90,000, with follow-through targets at $91,000 and $91,500. But until price clears that $88,000–$89,000 zone, rallies are at risk of being sold rather than chased. If BTC fails to reclaim resistance, the downside path is clear(h3) The near-term bear case is simple: if Bitcoin can’t climb back above the $87,000 area and keep traction, sellers may attempt another leg lower. Support levels line up like this: Immediate support: $85,500 First major support: $85,000 Next support: $83,500 Then $82,500 in the near term Below that, the major “don’t break this” level is still $80,000. If BTC slips under $80,000, the risk of acceleration to the downside increases significantly — not because it’s magic, but because it’s the kind of psychological and structural level that tends to trigger forced de-risking. Indicators: momentum still leans bearish(h3) The intraday indicators aren’t offering much comfort yet: Hourly MACD is losing pace in the bearish zone. Hourly RSI remains below 50, suggesting sellers still have the upper hand on short timeframes. So while the $85,000 defense held for now, the market hasn’t flipped bullish — it’s just stopped bleeding.
placeholder
December Santa Claus Rally: New highs in sight for US and European stocks?Historical data show a rising trend of US and European stocks in December. If the momentum is strong, fund managers may rush in with a buying frenzy.
Author  Mitrade
Yesterday 02: 50
Historical data show a rising trend of US and European stocks in December. If the momentum is strong, fund managers may rush in with a buying frenzy.
placeholder
XRP’s Price Action Flashes a Warning Even as ETF Flows Stay PositiveXRP’s structure remains weak despite 18 straight positive closes in spot XRP ETFs, with analysts warning that $1.98 and other nearby resistance zones could cap rebounds unless the YO region is reclaimed, while deeper downside scenarios keep $1.53 on watch as a potential (not guaranteed) accumulation area.
Author  Mitrade
Yesterday 06: 37
XRP’s structure remains weak despite 18 straight positive closes in spot XRP ETFs, with analysts warning that $1.98 and other nearby resistance zones could cap rebounds unless the YO region is reclaimed, while deeper downside scenarios keep $1.53 on watch as a potential (not guaranteed) accumulation area.
placeholder
Gold declines on profit-taking, USD strength ahead of US CPI releaseGold price (XAU/USD) edges lower below $4,350 during the Asian trading hours on Thursday. The precious metal retreats from seven-week highs amid some profit-taking and a rebound in the US Dollar (USD).
Author  FXStreet
6 hours ago
Gold price (XAU/USD) edges lower below $4,350 during the Asian trading hours on Thursday. The precious metal retreats from seven-week highs amid some profit-taking and a rebound in the US Dollar (USD).
goTop
quote