Prediction: This Hypergrowth AI Stock Will Finish 2026 With the Largest Market Cap in the World

Source The Motley Fool

Key Points

  • Alphabet has multiple levers it can pull to keep growing its market share in AI, which will lead to earnings growth.

  • Its operating earnings growth will help it achieve the largest market cap in the world in 2026.

  • 10 stocks we like better than Alphabet ›

The dominant megacap company of the last few years has been Nvidia (NASDAQ: NVDA). Today, it is worth $4.3 trillion, making it the most valuable company in the world by market capitalization. Riding the wave of spending on artificial intelligence (AI) hardware, the premier supplier of advanced parallel processing chips has seen gargantuan demand from customers, and it has faced relatively little competition.

I believe that has begun to change, and will continue to change in 2026, all due to one company: Alphabet (NASDAQ: GOOGL) (NASDAQ: GOOG). The technology giant has designed its own AI accelerator data center chips, which it both uses for its internal needs and rents access to through Google Cloud. With its growing market share in the AI services space, Alphabet looks poised to dethrone Nvidia as the largest company in the world by market value.

Where to invest $1,000 right now? Our analyst team just revealed what they believe are the 10 best stocks to buy right now, when you join Stock Advisor. See the stocks »

Two men looking at a giant computer screen with code flowing by.

Image source: Getty Images.

Full-stack infrastructure and distribution advantages

Over the past decade, Alphabet has developed its own AI data center chips, which it calls Tensor Processing Units (TPU). Excluding the actual manufacturing of the chips, Alphabet has a vertically integrated solution compared to other AI players, which reduces its need to buy expensive Nvidia hardware.

Alphabet -- which owns Google, YouTube, Google Cloud, and Android, and the Chrome browser, among other things -- uses these computer chips in its data centers to help handle the billions of AI queries it processes daily. It also has its own large language model, Gemini, as well as some of the best data sources in the world to train its AI tools with, thanks to the billions of people using its products. These billions of users also give Alphabet a distribution advantage for its Gemini chatbot.

This distribution advantage explains why Alphabet has been able to grow its market share compared to competitors such as OpenAI (which is also a customer of Nvidia). The Gemini App now has 650 million monthly active users, which is catching up quickly to ChatGPT's estimated 845 million. Not to mention all the existing users of Google services who are receiving answers powered by Gemini today.

Alphabet has multiple growth engines for earnings

As Gemini's capabilities grow, it can be pushed to the billions of people who use an Alphabet product every day. More usage should equate to more revenue growth across all of Alphabet's product lines.

There is the traditional Google Search business, which last quarter grew revenue 14.5% year over year. YouTube's advertising revenue grew 15%. Google Cloud grew by a whopping 34%, and subscriptions (which are where Gemini revenue is segmented) grew over 20%.

Revenue growth should continue through 2026 as Alphabet keeps taking market share in AI and riding a steady wave of sector adoption. In turn, this should lead to more earnings growth.

NVDA EBIT (TTM) Chart

Data by YCharts.

Why Alphabet will have the largest market cap in the world

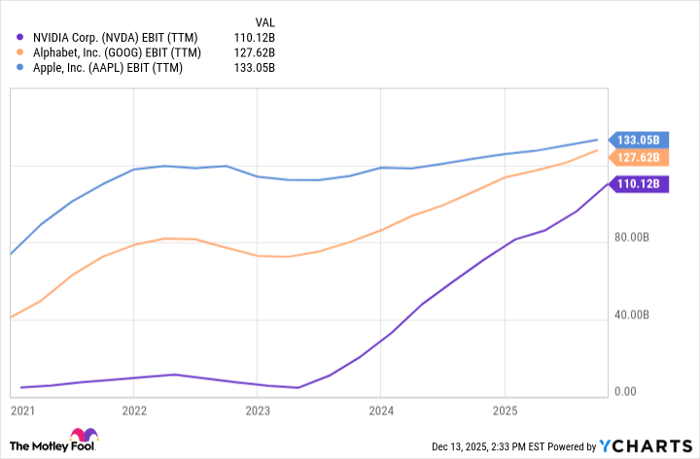
Nvidia does not generate as much in operating earnings (or earnings before interest and taxes) compared to the two stocks just behind it in the market cap rankings: Apple and Alphabet. However, Wall Street is valuing it at a higher price because of its faster growth. Its operating earnings have been soaring, and its revenue rose 62% year-over-year last quarter.

In 2026, due to increased competition from Alphabet's TPUs, I think Nvidia's revenue growth is going to slow down, causing the stock to trade at a lower earnings multiple. We are already seeing Alphabet make inroads with other big tech and AI customers, making reported deals with Apple for Gemini to power the Siri chatbot and Meta Platforms to utilize Google Cloud for its computing power needs. As it encroaches on Nvidia's turf, the AI chipmaker could lose further market share.

Alphabet generated $127 billion in operating income over the past 12 months, and is growing much faster than Apple, which generates $133 billion. Nvidia is a tad lower at $110 billion. If Alphabet exceeds Apple's earnings power next year while Nvidia simultaneously sees a slowdown in its earnings growth, I think Alphabet will finish next year as the world's largest market cap.

Should you buy stock in Alphabet right now?

Before you buy stock in Alphabet, consider this:

The Motley Fool Stock Advisor analyst team just identified what they believe are the 10 best stocks for investors to buy now… and Alphabet wasn’t one of them. The 10 stocks that made the cut could produce monster returns in the coming years.

Consider when Netflix made this list on December 17, 2004... if you invested $1,000 at the time of our recommendation, you’d have $505,695!* Or when Nvidia made this list on April 15, 2005... if you invested $1,000 at the time of our recommendation, you’d have $1,080,694!*

Now, it’s worth noting Stock Advisor’s total average return is 962% — a market-crushing outperformance compared to 193% for the S&P 500. Don't miss the latest top 10 list, available with Stock Advisor, and join an investing community built by individual investors for individual investors.

See the 10 stocks »

*Stock Advisor returns as of December 16, 2025.

Brett Schafer has no position in any of the stocks mentioned. The Motley Fool has positions in and recommends Alphabet, Apple, Meta Platforms, and Nvidia. The Motley Fool has a disclosure policy.

Disclaimer: For information purposes only. Past performance is not indicative of future results.
placeholder
U.S. November Nonfarm Payrolls: What Does the Rare "Weak Jobs, Strong Economy" Mix Mean for U.S. Equities?1. IntroductionAfter retreating from the late-October highs, U.S. equities embarked on a bottoming rebound in mid-to-late November, a trend driven by the interplay of multiple factors. That said, it i
Author  TradingKey
12 hours ago
1. IntroductionAfter retreating from the late-October highs, U.S. equities embarked on a bottoming rebound in mid-to-late November, a trend driven by the interplay of multiple factors. That said, it i
placeholder
Senate Delays Crypto Market Structure Hearings to Early 2026The Senate Banking Committee has postponed cryptocurrency market structure hearings until 2026, citing ongoing bipartisan negotiations.
Author  Mitrade
17 hours ago
The Senate Banking Committee has postponed cryptocurrency market structure hearings until 2026, citing ongoing bipartisan negotiations.
placeholder
Bitcoin Slides 5% as Sellers Lean In — Can BTC Reclaim $88,000?Bitcoin has dropped back below $88,000 after rolling over from $90,500, with price still trading under the 100-hour Simple Moving Average. The sell-off found a floor at $85,151, and BTC is now consolidating near that base, but rebounds are facing pressure from a bearish trend line around $89,000. Bulls need to retake $88,000–$89,000 to ease downside risk; failure to do so keeps $85,500–$85,000 and then $83,500 in play, with $80,000 as the deeper “line in the sand.” Bitcoin (BTC) is back in damage-control mode after a sharp pullback wiped out recent gains. The price failed to reclaim the $90,000–$90,500 band, rolled over, and slid through $88,500 before briefly dipping under $87,000. Buyers did show up around $85,000, but the rebound so far looks more like stabilization than a clear trend reversal. Bitcoin dips hard, finds a bid near $85,000(h3) BTC’s latest move lower began when it couldn’t build follow-through above $90,000 and $90,500. Once that upside stalled, sellers took control and pushed price down through $88,500. The slide accelerated enough to spike below $87,000, but the market didn’t free-fall. Bulls defended the $85,000 zone, printing a low at $85,151. Since then, Bitcoin has been consolidating below the 23.6% Fibonacci retracement of the drop from the $93,560 swing high to the $85,151 low — a clue that the bounce is still shallow and that sellers haven’t fully backed off yet. Structurally, BTC is still on the back foot: It’s trading below $88,000, and It remains below the 100-hour Simple Moving Average, keeping short-term trend pressure pointed downward. Resistance is layered, and $89,000 is the problem area(h3) If bulls try to turn this into a recovery, they’ll have to climb through multiple ceilings in quick succession. First, BTC faces resistance around $87,150, followed by a more meaningful barrier near $87,500. From there, the market’s attention snaps back to $88,000 — the level BTC just lost and now needs to reclaim. A close back above $88,000 would improve the tone, but it doesn’t solve the bigger issue: there’s a bearish trend line on the hourly BTC/USD chart (Kraken feed) with resistance near $89,000, which also lines up with the next technical hurdle. If BTC can push through $89,000 and hold, the rebound could extend toward $90,000, with follow-through targets at $91,000 and $91,500. But until price clears that $88,000–$89,000 zone, rallies are at risk of being sold rather than chased. If BTC fails to reclaim resistance, the downside path is clear(h3) The near-term bear case is simple: if Bitcoin can’t climb back above the $87,000 area and keep traction, sellers may attempt another leg lower. Support levels line up like this: Immediate support: $85,500 First major support: $85,000 Next support: $83,500 Then $82,500 in the near term Below that, the major “don’t break this” level is still $80,000. If BTC slips under $80,000, the risk of acceleration to the downside increases significantly — not because it’s magic, but because it’s the kind of psychological and structural level that tends to trigger forced de-risking. Indicators: momentum still leans bearish(h3) The intraday indicators aren’t offering much comfort yet: Hourly MACD is losing pace in the bearish zone. Hourly RSI remains below 50, suggesting sellers still have the upper hand on short timeframes. So while the $85,000 defense held for now, the market hasn’t flipped bullish — it’s just stopped bleeding.
Author  Mitrade
20 hours ago
Bitcoin has dropped back below $88,000 after rolling over from $90,500, with price still trading under the 100-hour Simple Moving Average. The sell-off found a floor at $85,151, and BTC is now consolidating near that base, but rebounds are facing pressure from a bearish trend line around $89,000. Bulls need to retake $88,000–$89,000 to ease downside risk; failure to do so keeps $85,500–$85,000 and then $83,500 in play, with $80,000 as the deeper “line in the sand.” Bitcoin (BTC) is back in damage-control mode after a sharp pullback wiped out recent gains. The price failed to reclaim the $90,000–$90,500 band, rolled over, and slid through $88,500 before briefly dipping under $87,000. Buyers did show up around $85,000, but the rebound so far looks more like stabilization than a clear trend reversal. Bitcoin dips hard, finds a bid near $85,000(h3) BTC’s latest move lower began when it couldn’t build follow-through above $90,000 and $90,500. Once that upside stalled, sellers took control and pushed price down through $88,500. The slide accelerated enough to spike below $87,000, but the market didn’t free-fall. Bulls defended the $85,000 zone, printing a low at $85,151. Since then, Bitcoin has been consolidating below the 23.6% Fibonacci retracement of the drop from the $93,560 swing high to the $85,151 low — a clue that the bounce is still shallow and that sellers haven’t fully backed off yet. Structurally, BTC is still on the back foot: It’s trading below $88,000, and It remains below the 100-hour Simple Moving Average, keeping short-term trend pressure pointed downward. Resistance is layered, and $89,000 is the problem area(h3) If bulls try to turn this into a recovery, they’ll have to climb through multiple ceilings in quick succession. First, BTC faces resistance around $87,150, followed by a more meaningful barrier near $87,500. From there, the market’s attention snaps back to $88,000 — the level BTC just lost and now needs to reclaim. A close back above $88,000 would improve the tone, but it doesn’t solve the bigger issue: there’s a bearish trend line on the hourly BTC/USD chart (Kraken feed) with resistance near $89,000, which also lines up with the next technical hurdle. If BTC can push through $89,000 and hold, the rebound could extend toward $90,000, with follow-through targets at $91,000 and $91,500. But until price clears that $88,000–$89,000 zone, rallies are at risk of being sold rather than chased. If BTC fails to reclaim resistance, the downside path is clear(h3) The near-term bear case is simple: if Bitcoin can’t climb back above the $87,000 area and keep traction, sellers may attempt another leg lower. Support levels line up like this: Immediate support: $85,500 First major support: $85,000 Next support: $83,500 Then $82,500 in the near term Below that, the major “don’t break this” level is still $80,000. If BTC slips under $80,000, the risk of acceleration to the downside increases significantly — not because it’s magic, but because it’s the kind of psychological and structural level that tends to trigger forced de-risking. Indicators: momentum still leans bearish(h3) The intraday indicators aren’t offering much comfort yet: Hourly MACD is losing pace in the bearish zone. Hourly RSI remains below 50, suggesting sellers still have the upper hand on short timeframes. So while the $85,000 defense held for now, the market hasn’t flipped bullish — it’s just stopped bleeding.
placeholder
AUD/USD remains depressed below mid-0.6600s; downside seems limited ahead of US NFP reportThe AUD/USD pair attracts some sellers for the fourth straight day on Tuesday and trades around the 0.6630 region, down just over 0.10%, during the Asian session.
Author  FXStreet
21 hours ago
The AUD/USD pair attracts some sellers for the fourth straight day on Tuesday and trades around the 0.6630 region, down just over 0.10%, during the Asian session.
placeholder
Macro Analysts: Hawkish Japan Could Push Bitcoin Below $70KAnalysts predict Bitcoin may face further declines towards the $70,000 mark if the Bank of Japan raises interest rates as expected.
Author  Mitrade
Yesterday 05: 48
Analysts predict Bitcoin may face further declines towards the $70,000 mark if the Bank of Japan raises interest rates as expected.
goTop
quote