EUR/USD ranges near 1.1750 as soft US jobs solidify Fed easing bias

Source Fxstreet
  • EUR/USD steady as US jobs data reinforce expectations for continued Fed easing into 2026.
  • Rising US Unemployment fails to boost January rate cut odds, keeping US Dollar sentiment constrained.
  • Hawkish Fed rhetoric and Trump’s potential Chair shortlist add uncertainty to US Dollar outlook.

EUR/USD holds firm at around 1.1750, virtually flat after the latest US jobs report reinforced the chances that the Federal Reserve (Fed) could continue its easing cycle into next year. At the time of writing, the pair posted minuscule losses of 0.04%.

Euro trades flat after US payrolls confirm labor market cooling, while US Dollar stays rangebound

US Nonfarm Payrolls figures for October and November were released earlier on Tuesday and revealed an already known picture of a weakening labor market. The Unemployment Rate rose above the FOMC’s December projections but failed to boost the chances of a rate cut at the January 28 meeting.

The US Dollar Index (DXY), which measures the American currency against six others, is virtually flat at 98.21, a headwind for the EUR/USD advancement.

Recently, Atlanta Fed President Raphael Bostic was hawkish and said that he would have left the fed funds rate unchanged at the December meeting.

At the time of writing, the swaps market had priced in 59.8 basis points of easing by December 2026.

Meanwhile, a Wall Street Journal article revealed that US President Donald Trump is set to interview Fed Governor Christopher Waller for the Fed top job, adding his name to the list consisting of National Economic Council Director Kevin Hassett and former Fed Governor Kevin Warsh.

Across the pond, a Reuters poll revealed that economists project the European Central Bank (ECB) will remain on hold throughout 2026 as they estimate inflation to remain subdued, but the economy is expected to stay resilient.

Ahead of the week, the ECB is expected to keep rates unchanged at the December 18 meeting.

Euro Price This week

The table below shows the percentage change of Euro (EUR) against listed major currencies this week. Euro was the strongest against the Australian Dollar.

USD EUR GBP JPY CAD AUD NZD CHF
USD -0.07% -0.32% -0.73% -0.08% 0.27% 0.27% -0.11%
EUR 0.07% -0.24% -0.65% -0.02% 0.36% 0.34% -0.04%
GBP 0.32% 0.24% -0.31% 0.24% 0.61% 0.58% 0.20%
JPY 0.73% 0.65% 0.31% 0.65% 1.01% 0.99% 0.82%
CAD 0.08% 0.02% -0.24% -0.65% 0.36% 0.35% 0.12%
AUD -0.27% -0.36% -0.61% -1.01% -0.36% -0.02% -0.40%
NZD -0.27% -0.34% -0.58% -0.99% -0.35% 0.02% -0.38%
CHF 0.11% 0.04% -0.20% -0.82% -0.12% 0.40% 0.38%

The heat map shows percentage changes of major currencies against each other. The base currency is picked from the left column, while the quote currency is picked from the top row. For example, if you pick the Euro from the left column and move along the horizontal line to the US Dollar, the percentage change displayed in the box will represent EUR (base)/USD (quote).

Daily market movers: Euro fails to rally despite soft US jobs data

  • Atlanta Fed President Raphael Bostic noted that the jobs report was a mixed picture and that it did not change the outlook, adding that he would have prefered to leave rates unchanged at the last Fed meeting. He said that “multiple surveys” are suggesting that there are higher input costs and that firms are determined to preserve their margins by increasing prices.
  • Bostic said, “Price pressures are not just coming from tariffs [and that the] Fed should not be hasty to declare victory,” adding that he sees GDP for 2026 at around 2.5%.
  • The US Bureau of Labor Statistics (BLS) reported that Nonfarm Payrolls rose by 64K in November, beating expectations of 50K and marking an improvement from October’s -105K print. However, the Unemployment Rate climbed to 4.6% from 4.4%, exceeding the 4.5% projection.
  • US Retail Sales were flat in October (0.0% MoM), easing from September’s 0.1% gain and missing forecasts for a 0.1% increase. Contrarily, Control-Group Sales—used to calculate the consumer spending component of GDP—recovered in the same period, rising by 0.8% after a 0.1% contraction previously.
  • Negotiations toward a peace deal in Ukraine remain ongoing. The United States has offered NATO-style security guarantees to Kyiv following talks between Trump and Ukrainian President Volodymyr Zelenskyy in Berlin, a development that has provided modest support to the Euro.

Technical outlook: EUR/USD remains upward bias despite remaining subdued

EUR/USD daily chart

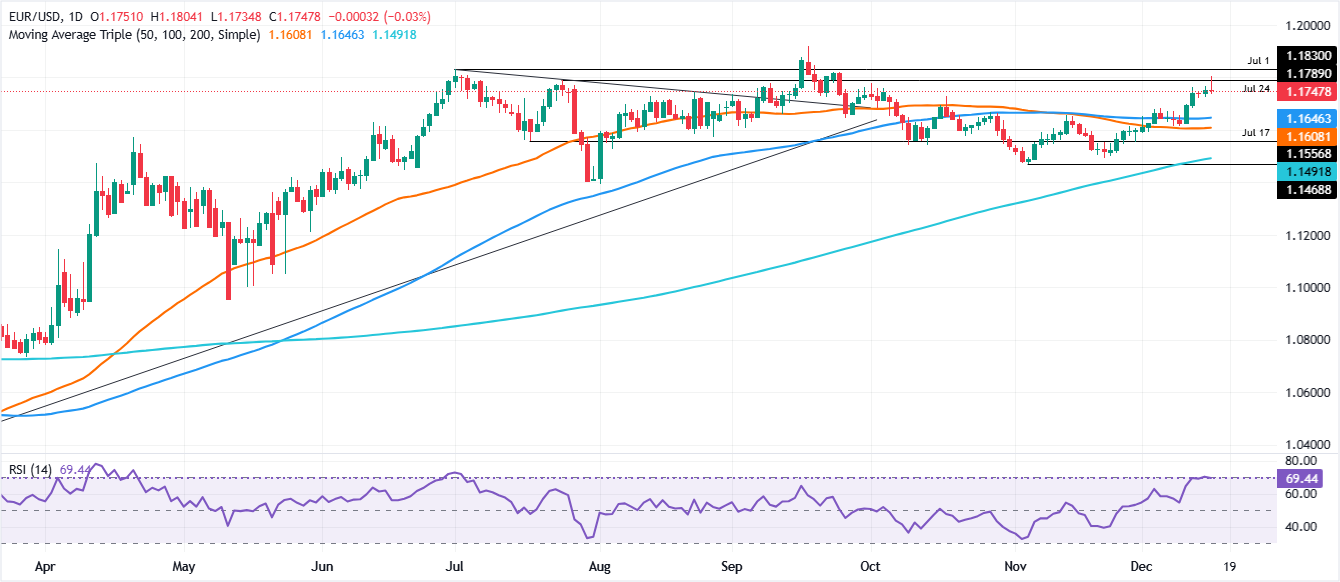
EUR/USD remains neutral to upwardly biased as price action seems to form a Gravestone Doji, an indication of traders’ indecision. Bullish momentum is fading as depicted by the Relative Strength Index (RSI).

For a bullish continuation, buyers must clear 1.1800, so they could challenge the 1.1850 region and, ultimately, the yearly high at 1.1918. On the flip side, the EUR/USD falling below 1.1700 clears the path to challenge the 100-day Simple Moving Average (SMA) near 1.1645, ahead of the 1.1600 handle.

Euro FAQs

The Euro is the currency for the 20 European Union countries that belong to the Eurozone. It is the second most heavily traded currency in the world behind the US Dollar. In 2022, it accounted for 31% of all foreign exchange transactions, with an average daily turnover of over $2.2 trillion a day. EUR/USD is the most heavily traded currency pair in the world, accounting for an estimated 30% off all transactions, followed by EUR/JPY (4%), EUR/GBP (3%) and EUR/AUD (2%).

The European Central Bank (ECB) in Frankfurt, Germany, is the reserve bank for the Eurozone. The ECB sets interest rates and manages monetary policy. The ECB’s primary mandate is to maintain price stability, which means either controlling inflation or stimulating growth. Its primary tool is the raising or lowering of interest rates. Relatively high interest rates – or the expectation of higher rates – will usually benefit the Euro and vice versa. The ECB Governing Council makes monetary policy decisions at meetings held eight times a year. Decisions are made by heads of the Eurozone national banks and six permanent members, including the President of the ECB, Christine Lagarde.

Eurozone inflation data, measured by the Harmonized Index of Consumer Prices (HICP), is an important econometric for the Euro. If inflation rises more than expected, especially if above the ECB’s 2% target, it obliges the ECB to raise interest rates to bring it back under control. Relatively high interest rates compared to its counterparts will usually benefit the Euro, as it makes the region more attractive as a place for global investors to park their money.

Data releases gauge the health of the economy and can impact on the Euro. Indicators such as GDP, Manufacturing and Services PMIs, employment, and consumer sentiment surveys can all influence the direction of the single currency. A strong economy is good for the Euro. Not only does it attract more foreign investment but it may encourage the ECB to put up interest rates, which will directly strengthen the Euro. Otherwise, if economic data is weak, the Euro is likely to fall. Economic data for the four largest economies in the euro area (Germany, France, Italy and Spain) are especially significant, as they account for 75% of the Eurozone’s economy.

Another significant data release for the Euro is the Trade Balance. This indicator measures the difference between what a country earns from its exports and what it spends on imports over a given period. If a country produces highly sought after exports then its currency will gain in value purely from the extra demand created from foreign buyers seeking to purchase these goods. Therefore, a positive net Trade Balance strengthens a currency and vice versa for a negative balance.

Disclaimer: For information purposes only. Past performance is not indicative of future results.
placeholder
U.S. November Nonfarm Payrolls: What Does the Rare "Weak Jobs, Strong Economy" Mix Mean for U.S. Equities?1. IntroductionAfter retreating from the late-October highs, U.S. equities embarked on a bottoming rebound in mid-to-late November, a trend driven by the interplay of multiple factors. That said, it i
Author  TradingKey
13 hours ago
1. IntroductionAfter retreating from the late-October highs, U.S. equities embarked on a bottoming rebound in mid-to-late November, a trend driven by the interplay of multiple factors. That said, it i
placeholder
Senate Delays Crypto Market Structure Hearings to Early 2026The Senate Banking Committee has postponed cryptocurrency market structure hearings until 2026, citing ongoing bipartisan negotiations.
Author  Mitrade
17 hours ago
The Senate Banking Committee has postponed cryptocurrency market structure hearings until 2026, citing ongoing bipartisan negotiations.
placeholder
Bitcoin Slides 5% as Sellers Lean In — Can BTC Reclaim $88,000?Bitcoin has dropped back below $88,000 after rolling over from $90,500, with price still trading under the 100-hour Simple Moving Average. The sell-off found a floor at $85,151, and BTC is now consolidating near that base, but rebounds are facing pressure from a bearish trend line around $89,000. Bulls need to retake $88,000–$89,000 to ease downside risk; failure to do so keeps $85,500–$85,000 and then $83,500 in play, with $80,000 as the deeper “line in the sand.” Bitcoin (BTC) is back in damage-control mode after a sharp pullback wiped out recent gains. The price failed to reclaim the $90,000–$90,500 band, rolled over, and slid through $88,500 before briefly dipping under $87,000. Buyers did show up around $85,000, but the rebound so far looks more like stabilization than a clear trend reversal. Bitcoin dips hard, finds a bid near $85,000(h3) BTC’s latest move lower began when it couldn’t build follow-through above $90,000 and $90,500. Once that upside stalled, sellers took control and pushed price down through $88,500. The slide accelerated enough to spike below $87,000, but the market didn’t free-fall. Bulls defended the $85,000 zone, printing a low at $85,151. Since then, Bitcoin has been consolidating below the 23.6% Fibonacci retracement of the drop from the $93,560 swing high to the $85,151 low — a clue that the bounce is still shallow and that sellers haven’t fully backed off yet. Structurally, BTC is still on the back foot: It’s trading below $88,000, and It remains below the 100-hour Simple Moving Average, keeping short-term trend pressure pointed downward. Resistance is layered, and $89,000 is the problem area(h3) If bulls try to turn this into a recovery, they’ll have to climb through multiple ceilings in quick succession. First, BTC faces resistance around $87,150, followed by a more meaningful barrier near $87,500. From there, the market’s attention snaps back to $88,000 — the level BTC just lost and now needs to reclaim. A close back above $88,000 would improve the tone, but it doesn’t solve the bigger issue: there’s a bearish trend line on the hourly BTC/USD chart (Kraken feed) with resistance near $89,000, which also lines up with the next technical hurdle. If BTC can push through $89,000 and hold, the rebound could extend toward $90,000, with follow-through targets at $91,000 and $91,500. But until price clears that $88,000–$89,000 zone, rallies are at risk of being sold rather than chased. If BTC fails to reclaim resistance, the downside path is clear(h3) The near-term bear case is simple: if Bitcoin can’t climb back above the $87,000 area and keep traction, sellers may attempt another leg lower. Support levels line up like this: Immediate support: $85,500 First major support: $85,000 Next support: $83,500 Then $82,500 in the near term Below that, the major “don’t break this” level is still $80,000. If BTC slips under $80,000, the risk of acceleration to the downside increases significantly — not because it’s magic, but because it’s the kind of psychological and structural level that tends to trigger forced de-risking. Indicators: momentum still leans bearish(h3) The intraday indicators aren’t offering much comfort yet: Hourly MACD is losing pace in the bearish zone. Hourly RSI remains below 50, suggesting sellers still have the upper hand on short timeframes. So while the $85,000 defense held for now, the market hasn’t flipped bullish — it’s just stopped bleeding.
Author  Mitrade
20 hours ago
Bitcoin has dropped back below $88,000 after rolling over from $90,500, with price still trading under the 100-hour Simple Moving Average. The sell-off found a floor at $85,151, and BTC is now consolidating near that base, but rebounds are facing pressure from a bearish trend line around $89,000. Bulls need to retake $88,000–$89,000 to ease downside risk; failure to do so keeps $85,500–$85,000 and then $83,500 in play, with $80,000 as the deeper “line in the sand.” Bitcoin (BTC) is back in damage-control mode after a sharp pullback wiped out recent gains. The price failed to reclaim the $90,000–$90,500 band, rolled over, and slid through $88,500 before briefly dipping under $87,000. Buyers did show up around $85,000, but the rebound so far looks more like stabilization than a clear trend reversal. Bitcoin dips hard, finds a bid near $85,000(h3) BTC’s latest move lower began when it couldn’t build follow-through above $90,000 and $90,500. Once that upside stalled, sellers took control and pushed price down through $88,500. The slide accelerated enough to spike below $87,000, but the market didn’t free-fall. Bulls defended the $85,000 zone, printing a low at $85,151. Since then, Bitcoin has been consolidating below the 23.6% Fibonacci retracement of the drop from the $93,560 swing high to the $85,151 low — a clue that the bounce is still shallow and that sellers haven’t fully backed off yet. Structurally, BTC is still on the back foot: It’s trading below $88,000, and It remains below the 100-hour Simple Moving Average, keeping short-term trend pressure pointed downward. Resistance is layered, and $89,000 is the problem area(h3) If bulls try to turn this into a recovery, they’ll have to climb through multiple ceilings in quick succession. First, BTC faces resistance around $87,150, followed by a more meaningful barrier near $87,500. From there, the market’s attention snaps back to $88,000 — the level BTC just lost and now needs to reclaim. A close back above $88,000 would improve the tone, but it doesn’t solve the bigger issue: there’s a bearish trend line on the hourly BTC/USD chart (Kraken feed) with resistance near $89,000, which also lines up with the next technical hurdle. If BTC can push through $89,000 and hold, the rebound could extend toward $90,000, with follow-through targets at $91,000 and $91,500. But until price clears that $88,000–$89,000 zone, rallies are at risk of being sold rather than chased. If BTC fails to reclaim resistance, the downside path is clear(h3) The near-term bear case is simple: if Bitcoin can’t climb back above the $87,000 area and keep traction, sellers may attempt another leg lower. Support levels line up like this: Immediate support: $85,500 First major support: $85,000 Next support: $83,500 Then $82,500 in the near term Below that, the major “don’t break this” level is still $80,000. If BTC slips under $80,000, the risk of acceleration to the downside increases significantly — not because it’s magic, but because it’s the kind of psychological and structural level that tends to trigger forced de-risking. Indicators: momentum still leans bearish(h3) The intraday indicators aren’t offering much comfort yet: Hourly MACD is losing pace in the bearish zone. Hourly RSI remains below 50, suggesting sellers still have the upper hand on short timeframes. So while the $85,000 defense held for now, the market hasn’t flipped bullish — it’s just stopped bleeding.
placeholder
AUD/USD remains depressed below mid-0.6600s; downside seems limited ahead of US NFP reportThe AUD/USD pair attracts some sellers for the fourth straight day on Tuesday and trades around the 0.6630 region, down just over 0.10%, during the Asian session.
Author  FXStreet
21 hours ago
The AUD/USD pair attracts some sellers for the fourth straight day on Tuesday and trades around the 0.6630 region, down just over 0.10%, during the Asian session.
placeholder
Macro Analysts: Hawkish Japan Could Push Bitcoin Below $70KAnalysts predict Bitcoin may face further declines towards the $70,000 mark if the Bank of Japan raises interest rates as expected.
Author  Mitrade
Yesterday 05: 48
Analysts predict Bitcoin may face further declines towards the $70,000 mark if the Bank of Japan raises interest rates as expected.
goTop
quote