
The Stock Market Is Doing Something Witnessed Only 2 Times in 153 Years -- and History Is Very Clear About What May Happen in 2026.
Key Points
Excitement about AI stocks has driven the S&P 500 to record levels this year.
The major benchmark is on track for its third annual increase -- and each time the gain has been in the double digits.
- 10 stocks we like better than S&P 500 Index ›
The S&P 500 is heading for a third consecutive annual gain in the double digits as the bull market momentum continues -- and the index even closed at record levels in recent days. What's driven this seemingly unstoppable energy? Over the past couple of years, investors have rushed into artificial intelligence (AI) stocks -- in many cases, these players weigh heavily in the index, so they can significantly impact the index's direction. I'm talking about names such as Nvidia and Alphabet, for example, AI stocks that have climbed more than 30% and 60%, respectively, this year.
Investors are betting on AI players because the technology may be a potential game changer, like the internet or, traveling much farther back in time, the telephone or the printing press. In the case of AI, analysts expect it to make business operations easier, faster, and cheaper -- and AI can spur innovation too. All of this makes it a very promising technology, and one that's already supercharged the earnings and stock performance of certain companies.
Where to invest $1,000 right now? Our analyst team just revealed what they believe are the 10 best stocks to buy right now. Continue »
A lower interest rate environment also has spurred investor optimism over the past year, as the Federal Reserve launched a series of rate cuts -- with the most recent one happening this month. Lower rates equal lower borrowing costs for companies, and more buying power for the consumer -- all of this is positive for earnings growth.
This market momentum has led to the stock market doing something witnessed only twice over the past 153 years -- and history is very clear about what might happen in 2026.

Image source: Getty Images.
The AI boom marches on
The enthusiasm over the past couple of years has been accompanied by solid earnings growth from leading tech giants as well as ongoing spending in AI. And those providing AI products and services, from Nvidia to Amazon and Palantir Technologies, have spoken of enormous demand. Customers are rushing to them for help to build AI platforms or apply AI to their businesses.
All of this has sparked the market to do something rare in recent times, something witnessed only twice -- back in 2000 and today. This has to do with the S&P 500 Shiller CAPE ratio, an inflation-adjusted measure of valuation. The metric considers earnings per share and stock price over a 10-year period.
In recent times, the S&P 500 Shiller CAPE ratio has reached the level of 39 -- the only other time it reached, and even surpassed, this level was more than 20 years ago, as prices of dot-com stocks soared.
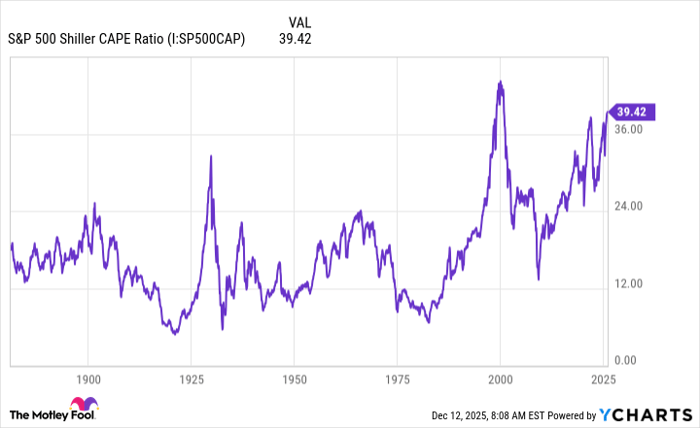
S&P 500 Shiller CAPE Ratio data by YCharts
Are we in an AI bubble?
Now, you might say: Uh, oh... does this mean we're in a bubble? Not necessarily. Though investors have worried about such a scenario in recent weeks, evidence doesn't strongly support it. The AI boom is backed by solid companies with the financial strength to invest in this new technology, and as I mentioned earlier, earnings growth continues.
Still, the Shiller CAPE ratio is telling us that stocks are expensive right now -- at their second-highest level ever. And history is very clear about what may happen in 2026. After every significant peak in valuation, the S&P 500 has gone on to fall -- in the chart below, you can see this trend over the past decade. Considering the sky-high level of valuations right now, if history is right, the S&P 500 is on track to decline next year.
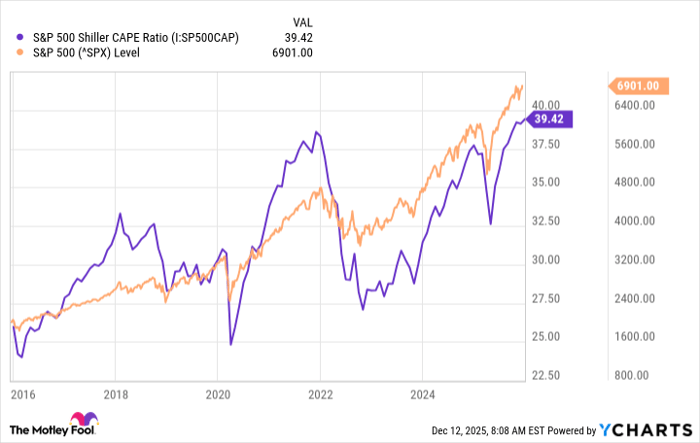
S&P 500 Shiller CAPE Ratio data by YCharts
Something to know about history
But there are a few things to keep in mind. First, history isn't always right. Though declines eventually happen, because the index can't climb uninterrupted forever, this movement could come much later than expected. Second, the S&P 500 may be on track for declines in 2026, but this doesn't mean the trend will last all year, and the index will finish in the doldrums. It's possible stocks will pull back for a few weeks or months and then recover.
And finally, the most important point of all is the following -- and it's something that history has always been right about. After even the worst declines and market crashes, the S&P 500 has gone on to recover and advance every single time. How can you benefit from this? By buying quality stocks and holding on for the long term -- so you may score a significant win no matter what the market does in 2026.
Should you invest $1,000 in S&P 500 Index right now?
Before you buy stock in S&P 500 Index, consider this:
The Motley Fool Stock Advisor analyst team just identified what they believe are the 10 best stocks for investors to buy now… and S&P 500 Index wasn’t one of them. The 10 stocks that made the cut could produce monster returns in the coming years.
Consider when Netflix made this list on December 17, 2004... if you invested $1,000 at the time of our recommendation, you’d have $507,421!* Or when Nvidia made this list on April 15, 2005... if you invested $1,000 at the time of our recommendation, you’d have $1,109,138!*
Now, it’s worth noting Stock Advisor’s total average return is 972% — a market-crushing outperformance compared to 195% for the S&P 500. Don’t miss out on the latest top 10 list, available when you join Stock Advisor.
See the 10 stocks »
*Stock Advisor returns as of December 8, 2025
Adria Cimino has positions in Amazon. The Motley Fool has positions in and recommends Alphabet, Amazon, Nvidia, and Palantir Technologies. The Motley Fool has a disclosure policy.
Recommended Articles


