
The Federal Reserve Just Made Dubious History That Can Lead to a Crisis of Confidence on Wall Street in the New Year
Key Points
The Dow Jones Industrial Average, S&P 500, and Nasdaq Composite have enjoyed another banner year, with these indexes rising by 13%, 17%, and 22%, respectively.
The latest Federal Open Market Committee vote to cut rates was unique in all the wrong ways.
A shake-up on Wall Street may be forthcoming with the central bank no longer acting as a stabilizing force amid a historically pricey stock market.
- 10 stocks we like better than S&P 500 Index ›
Although it's been a year filled with twists and turns, Wall Street's major stock indexes have continued their trek higher. The ageless Dow Jones Industrial Average (DJINDICES: ^DJI), broad-based S&P 500 (SNPINDEX: ^GSPC), and growth stock-dominated Nasdaq Composite (NASDAQINDEX: ^IXIC) have rallied 13%, 17%, and 22% on a year-to-date basis, as of the closing bell on Dec. 10.
Hot trends have been a significant theme, once again, in propelling this bull market to new heights. The rise of artificial intelligence and quantum computing, coupled with a handful of blockbuster stock splits, has kept the embers of optimism burning bright among investors.
Where to invest $1,000 right now? Our analyst team just revealed what they believe are the 10 best stocks to buy right now. Continue »
Further, investors have been excited about the prospect of future interest rate cuts. Although the Federal Reserve has come through with three long-anticipated rate cuts to end the year, it's made dubious history in the process and left Wall Street vulnerable to a crisis of confidence in the new year.

Fed Chair Jerome Powell delivering remarks. Image source: Official Federal Reserve Photo.
A central bank divided against itself cannot stand
In simple terms, the Federal Reserve is tasked with overseeing the nation's monetary policy. Its goal is to maximize employment while maintaining stable prices. In this context, "stable prices" would mean a modest inflation rate (rising prices) that's close to the central bank's long-term target of 2%.
The most common way Fed Chair Jerome Powell and the 11 other members of the Federal Open Market Committee (FOMC) influence monetary policy is by adjusting the federal funds rate, which is the overnight lending rate banks charge each other.
Raising this rate creates ripples throughout the economy, making borrowing costlier for businesses and consumers, and can ultimately lower the prevailing inflation rate. Meanwhile, reducing the federal funds rate is designed to encourage lending and spark economic growth.
The central bank can also undertake open market operations, such as the purchase and sale of long-term Treasury bonds, which can impact yields. Bond prices and yields are inversely related.
The members of the FOMC aren't omniscient. They have a very good understanding of how a multitude of variables can push and pull on the U.S. economy. But there isn't a one-size-fits-all blueprint to tackling monetary policy. If there were, we wouldn't need the Fed in the first place.
Wall Street and investors have demonstrated a willingness to navigate an occasional incorrect call or delayed action by the nation's central bank. What they're unlikely to tolerate is a divided Fed.
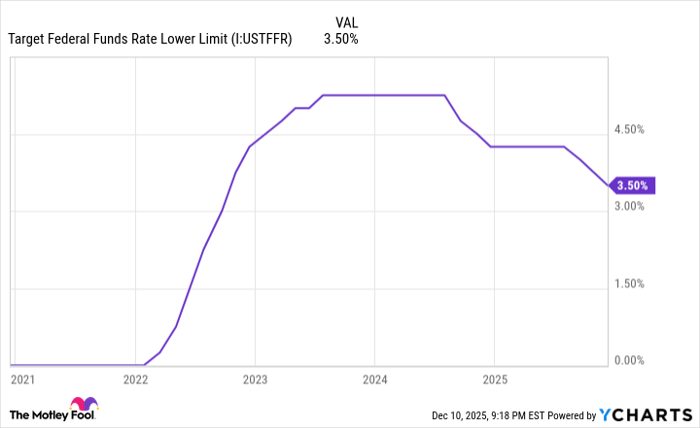
Target Federal Funds Rate Lower Limit data by YCharts.
On Wednesday, Dec. 10, the FOMC voted 9-3 to reduce the federal funds rate by 25 basis points to a fresh range of 3.50% to 3.75%. What made this vote so unique is that it involved three dissentions:
- Kansas City Fed President Jeffrey Schmid dissented in favor of no decrease.
- Chicago Fed President Austan Goolsbee dissented in favor of no decrease.
- Fed Governor Stephen Miran dissented in favor of a 50-basis-point decrease.
Although this was the first time since September 2019 that the FOMC had three dissentions in the same meeting, there was even more dubious history made.
Since 1990, there have been three FOMC meetings where multiple members have dissented in opposite directions (i.e., no rate cut versus a larger-than-expected rate cut). The Dec. 10 FOMC decision marked the second meeting in a row, and the third total meeting in 35 years, with multiple dissents in opposite directions.
While investors might not always agree with the Fed's commentary or the FOMC's actions, the central bank is, nevertheless, viewed as a stabilizing and calming force for the stock market. Consistency in messaging has historically been paramount to the success of the Dow Jones Industrial Average, S&P 500, and Nasdaq Composite. Without this cohesiveness, the door is wide open for a crisis of confidence to manifest amid a historically pricey stock market.

Fed Chair Jerome Powell with President Donald Trump. Image source: Official White House Photo by Daniel Torok.
A shake-up on Wall Street may be forthcoming
In case a divided Fed isn't enough of a worry for investors, President Donald Trump will also be nominating a successor to Jerome Powell, whose term as Fed chair comes to an end in May 2026.
According to most predictions, Kevin Hassett is the frontrunner for the head position at the Fed. Hassett would almost certainly bring a dovish tone to the nation's central bank and champion further rate cuts, which is the preference of President Trump.
However, some analysts and investors have questioned Hassett's ability to lead the Fed in 2026 (and beyond). Additionally, prioritizing rate cuts without considering the steadily rising inflation rate could prove problematic for the U.S. economy.
Since the effects of Donald Trump's tariff and trade policy began making their presence known in economic data releases, we've witnessed the trailing 12-month inflation rate jump from 2.31% to 3.01%. This may not sound like much, but it signals the pricing issues some domestic manufacturers are facing as a result of the president's tariffs. Further rate cuts in 2026 have the potential to reignite inflation in the U.S.
All the while, investors will be tasked with navigating a historically pricey stock market.
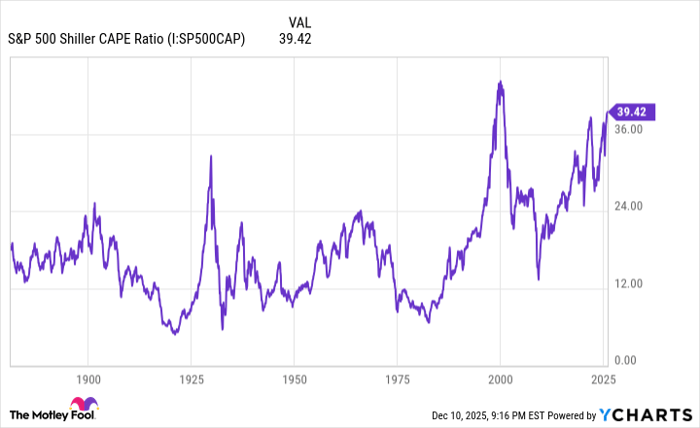
S&P 500 Shiller CAPE Ratio data by YCharts. CAPE Ratio = cyclically adjusted price-to-earnings ratio.
Even though value is a subjective term (what you find to be expensive might be viewed as a bargain by another investor), the S&P 500's Shiller Price-to-Earnings Ratio, which is also known as the cyclically adjusted P/E Ratio, or CAPE Ratio, leaves little margin for argument about the priciness of stocks.
Dating back to January 1871, the Shiller P/E has averaged a multiple of approximately 17.3. As of the closing bell on Dec. 10, the S&P 500's CAPE Ratio hit 40.57, which is just a shade below its peak of 41.20 during the current bull market.
To put this figure into context, the Shiller P/E has only been higher one time in 155 years, with a maximum multiple of 44.19 in December 1999, just a couple of months before the dot-com bubble burst. Including the present, there have been only six instances since January 1871 in which the Shiller P/E has topped 30 during a continuous bull market. The previous five occurrences were all eventually followed by declines of 20% to 89% in one or more of Wall Street's major stock indexes.
The stock market is historically expensive, and one of its most stabilizing forces, the Fed, lacks consistent messaging. This is shaping up to be a potentially volatile and disappointing year for Wall Street in 2026.
Should you invest $1,000 in S&P 500 Index right now?
Before you buy stock in S&P 500 Index, consider this:
The Motley Fool Stock Advisor analyst team just identified what they believe are the 10 best stocks for investors to buy now… and S&P 500 Index wasn’t one of them. The 10 stocks that made the cut could produce monster returns in the coming years.
Consider when Netflix made this list on December 17, 2004... if you invested $1,000 at the time of our recommendation, you’d have $507,421!* Or when Nvidia made this list on April 15, 2005... if you invested $1,000 at the time of our recommendation, you’d have $1,109,138!*
Now, it’s worth noting Stock Advisor’s total average return is 972% — a market-crushing outperformance compared to 195% for the S&P 500. Don’t miss out on the latest top 10 list, available when you join Stock Advisor.
See the 10 stocks »
*Stock Advisor returns as of December 8, 2025
Sean Williams has no position in any of the stocks mentioned. The Motley Fool has no position in any of the stocks mentioned. The Motley Fool has a disclosure policy.
Recommended Articles


