
US Dollar consolidates as markets digest the Taiwanese Dollar’s shockwave
- The US Dollar Index edges slightly lower, although the daily range gets tighter.
- Traders are assessing the spillover risk from the Taiwan Dollar surge on Monday to other currencies in the region.
- The US Dollar Index remains capped below 100.00, still stuck in a wait-and-see range.
The US Dollar Index (DXY), which tracks the performance of the US Dollar (USD) against six major currencies, edges lower while remaining stuck in a very tight range on Tuesday. Market participants are assessing the recent sharp move in the Taiwan Dollar (TWD), which appreciated by more than 5% against the Greenback on Monday before retreating somewhat on Tuesday. Markets are trying to assess if a spillover effect could occur, affecting bigger Asian currencies such as the South Korean Won (KRW), the Japanese Yen (JPY) or the Chinese Renminbi (CNH).
Meanwhile, on the geopolitical front, a swarm of headlines are making its way to the markets, with the most recent the upcoming German Chancellor Friedrich Merz falling short of a majority in the German parliament vote to become the new Chancellor. On the other side of the Atlantic, US Commerce Secretary Howard Lutnick jacked up stakes for the Trump administration to deliver an initial trade deal soon by saying that the first deal needs to be with a “top ten” economy, he said on Fox News. In Europe, the war between Russia and Ukraine is heating up with drone attacks on both sides, while Israel is further preparing a ground offensive with the goal of fully controlling the Gaza Strip.
Daily digest market movers: Slow data before the Fed
- At 12:30 GMT, the US Goods and Services Trade Balance for March is due. Expectations are for a wider deficit at $129 billion against the $122.7 billion deficit from February.
- Equities are all over the place as several countries in Asia remain closed for a public holiday. European indexes are up around 0.50% on the day, while US futures look under pressure with the Nasdaq down near 1%.
- The CME FedWatch tool shows the chance of an interest rate cut by the Federal Reserve in May's meeting stands at 3.2% against a 96.8% probability of no change. The June meeting sees a 31.8% chance of a rate cut.
- The US 10-year yields trade around 4.31%, erasing past weeks’ softening as traders have even priced out the chances for a June rate cut.
US Dollar Index Technical Analysis: Inside pressure
The US Dollar Index (DXY) is facing some headwinds after US Commerce Secretary Lutnick ramped up pressure from within the Trump administration to get an initial trade deal done. Lutnick added that the initial deal should be with a top ten economy, in order to set an example. Despite several claims from US President Donald Trump and several cabinet members that deals are imminent, no real signed trade deals have been announced.
On the upside, the DXY’s first resistance comes in at 100.22, which supported the DXY back in September 2024, with a break back above the 100.00 round level as a bullish signal. A firm recovery would be a return to 101.90, which acted as a pivotal level throughout December 2023 and again as a base for the inverted head-and-shoulders (H&S) formation during the summer of 2024.
On the other hand, the 97.73 support could quickly be tested on any substantial bearish headline. Further below, a relatively thin technical support comes in at 96.94 before looking at the lower levels of this new price range. These would be at 95.25 and 94.56, meaning fresh lows not seen since 2022.
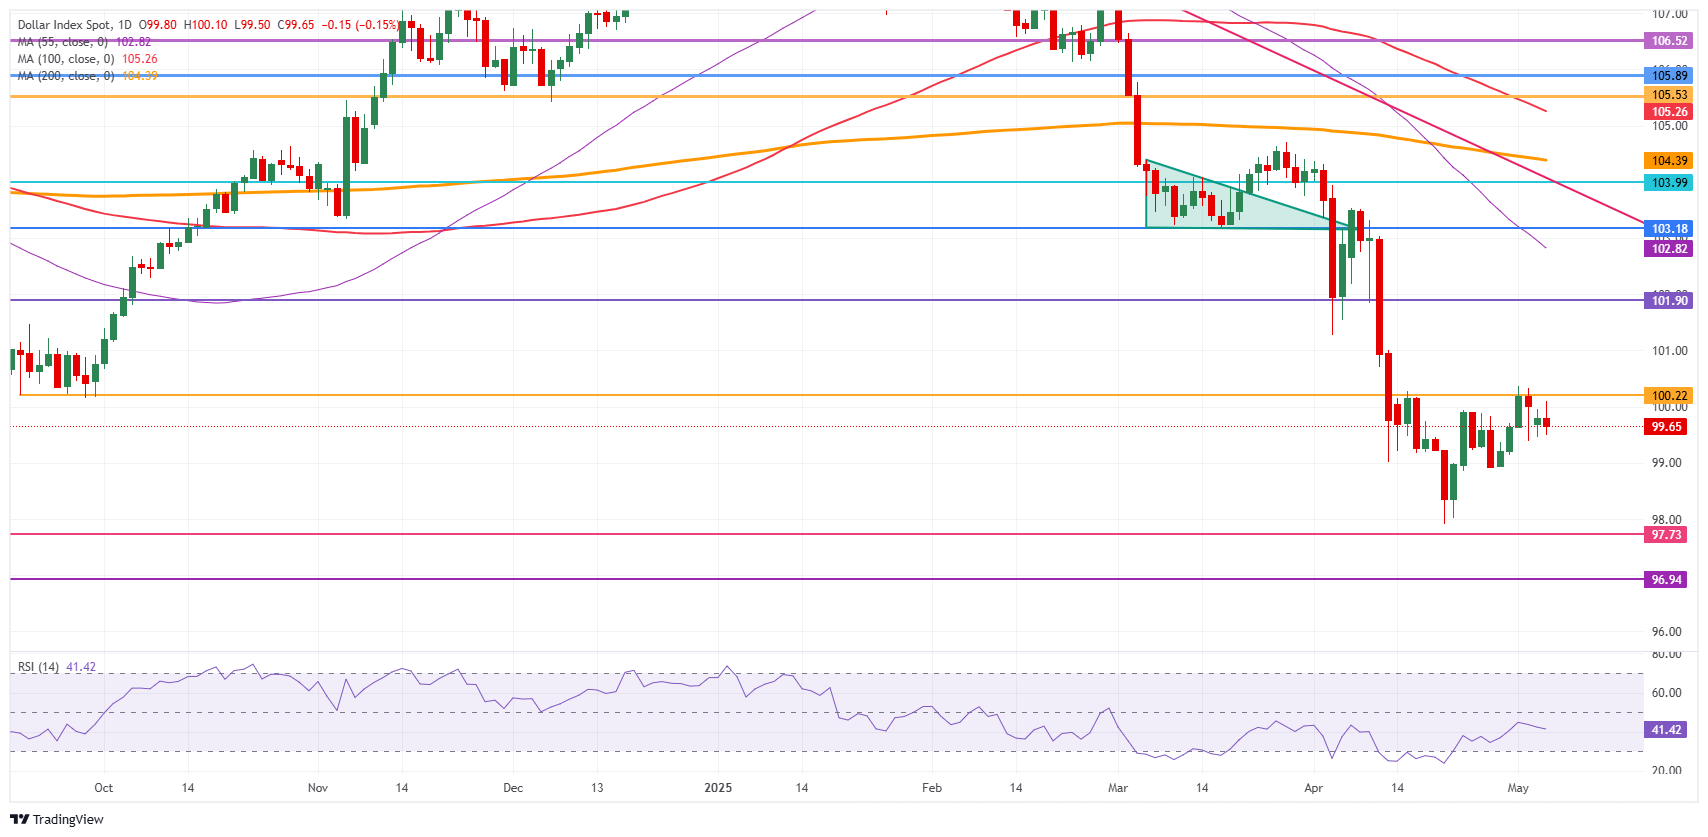
US Dollar Index: Daily Chart
US-China Trade War FAQs
Generally speaking, a trade war is an economic conflict between two or more countries due to extreme protectionism on one end. It implies the creation of trade barriers, such as tariffs, which result in counter-barriers, escalating import costs, and hence the cost of living.
An economic conflict between the United States (US) and China began early in 2018, when President Donald Trump set trade barriers on China, claiming unfair commercial practices and intellectual property theft from the Asian giant. China took retaliatory action, imposing tariffs on multiple US goods, such as automobiles and soybeans. Tensions escalated until the two countries signed the US-China Phase One trade deal in January 2020. The agreement required structural reforms and other changes to China’s economic and trade regime and pretended to restore stability and trust between the two nations. However, the Coronavirus pandemic took the focus out of the conflict. Yet, it is worth mentioning that President Joe Biden, who took office after Trump, kept tariffs in place and even added some additional levies.
The return of Donald Trump to the White House as the 47th US President has sparked a fresh wave of tensions between the two countries. During the 2024 election campaign, Trump pledged to impose 60% tariffs on China once he returned to office, which he did on January 20, 2025. With Trump back, the US-China trade war is meant to resume where it was left, with tit-for-tat policies affecting the global economic landscape amid disruptions in global supply chains, resulting in a reduction in spending, particularly investment, and directly feeding into the Consumer Price Index inflation.
Recommended Articles


