Will the Bank of England Continue Rate Cuts? What's the Pound's Trajectory in 2026?

Source Tradingkey

TradingKey - The Bank of England decided to keep interest rates unchanged at its meeting last month with a narrow 5-4 vote. This Thursday, the market will once again focus on the Bank of England's interest rate decision. As the UK's November CPI data fell to 3.2% and the labor market cooled, with the UK's three-month ILO unemployment rate rising to 5.1% in October, a 0.1 percentage point increase from the previous quarter, this has cleared the way for a potential rate cut by the Bank of England. GBP/USD has shown strong performance over the past month, rising from around 1.30 to 1.34, and has not declined despite expectations of a central bank rate cut. In the upcoming year 2026, GBP/USD may experience volatile pullbacks, testing support levels near 1.25.

The UK labor market continues to cool, further softening under the impact of weak economic growth, leading to persistently high unemployment. Data released by the UK's Office for National Statistics (ONS) on the 16th showed that the UK unemployment rate for August-October 2025 was 5.1%, higher than the same period a year ago and also above the level of the preceding three months. Concurrently, the UK employment rate for August-October stood at 74.9%, roughly flat compared to the same period last year but lower than the preceding three months.

Amidst the slowdown in the job market, the growth rate of employee earnings in the UK is also decelerating. Excluding bonuses, UK employee wages grew by 4.6% year-on-year in August-October; including bonuses, the growth was 4.7%. Wage growth in the private sector decreased from the previous 4.2% to 3.9%, while public sector earnings growth rose from 6.6% to 7.6%.

UK inflation is slowing, with the latest data showing that the UK Consumer Price Index (CPI) rose 3.2% year-on-year in November, a notable decrease from 3.6% in October, marking an eight-month low. This figure was also below economists' expectations of 3.5% and the Bank of England's own forecast of 3.4%. During the same period, core CPI annual growth also fell to 3.2%, and services prices increased by 4.4% year-on-year, slightly below the central bank's previous expectation of 4.5%. The weak data could prompt the Bank of England to resume its rate-cutting cycle this Thursday, following pauses in September and November.

Bank of England Governor Andrew Bailey had previously signaled a policy shift, emphasizing the need for more evidence of declining inflation before considering further rate cuts. Furthermore, the Bank of England's Monetary Policy Committee (MPC) departed from its previous "hawkish" stance at its November meeting, voting 5-4 to keep interest rates unchanged, with 5 votes to maintain rates and 4 votes for a cut, and acknowledging that inflation risks were becoming balanced. Economists anticipate the Bank of England will cut rates in December by a narrow 5-4 margin.

Morgan Stanley no longer expects the Bank of England to cut rates in March 2026, but continues to forecast rate cuts in February, April, and June 2026, with the terminal rate revised up to 3%, higher than its previous forecast of 2.75%.

Nomura expects the Bank of England to cut rates by 25 basis points in April 2026, previously forecasting a cut in February; it maintains its terminal rate forecast at 3.50%. In addition, UBS anticipates three 25 basis point rate cuts by the Bank of England in 2026, bringing the interest rate down to 3% by July 2026.

The weakening labor market, coupled with receding inflation, will likely compel the Bank of England to maintain its rate-cutting trajectory in 2026. This will put pressure on the pound, reversing the volatile rebound seen in 2025, with GBP/USD potentially retesting the support level at 1.25.

The U.S. labor market is also slowing down; data showed that seasonally adjusted non-farm payrolls in the U.S. recorded 64,000 in November, higher than the market consensus expectation of 45,000. In contrast, October saw a decrease of 105,000 jobs, with expectations of a 25,000 decline. Furthermore, the U.S. unemployment rate rose to 4.6% in November, exceeding market expectations of 4.4% and reaching its highest level since September 2021.

The Federal Reserve conducted its third rate cut of the year in December, by 25 basis points, extending this easing cycle. New York Fed President John Williams stated that following last week's rate cut, monetary policy is well-positioned for the coming year, facing rising employment risks and slightly diminished inflation risks.

Wells Fargo, meanwhile, indicated that its base forecast projects two 25 basis point rate cuts by the Federal Reserve in the first half of 2026, at the March and June FOMC meetings, with the possibility of further cuts.

Philip Marey, Senior Strategist at Rabobank, noted that to stimulate the economy ahead of the U.S. midterm elections, the Federal Reserve is expected to lower interest rates to neutral or even lower levels by November 2026, with the federal funds rate target range reaching 2.75%-3.00% by September 2026. The current range is 3.5%-3.75%.

gbp-c0342ca2103d43ee875465fa7c4b6f64

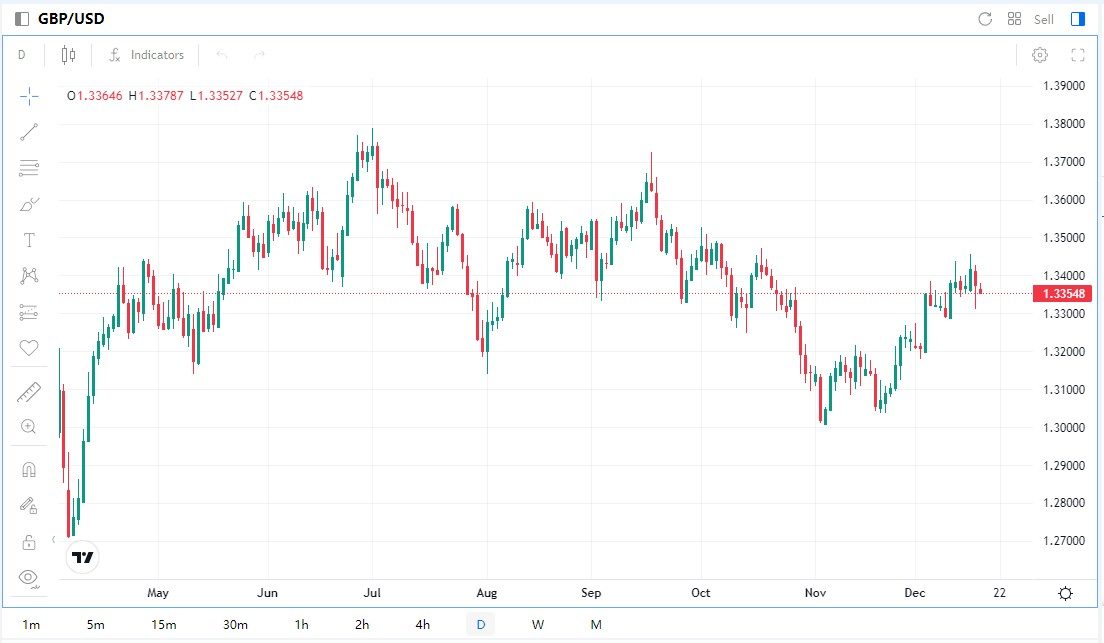
Source: Mitrade GBP/USD Performance

Technically, GBP/USD began to strengthen with volatile upward movements in late November, rising from around 1.30 to 1.34, indicating a strengthening trend. However, there is strong resistance near 1.35; if it fails to break above this level effectively, it could still face pressure to reverse downwards. On the daily chart, various moving averages continue to point upwards, suggesting that the short-term trend remains bullish. However, the KDJ indicator has started to turn downwards, indicating a strengthening of bearish market forces, which could suppress GBP/USD's performance, potentially testing the 1.32 level before the end of December.

For GBP/USD, initial upward resistance is located at 1.3500, with further resistance at 1.3700, and key resistance at 1.4000. Initial downward support for GBP/USD is at 1.3100, with further support at 1.2900, and a more critical support level at 1.2600.

Disclaimer: For information purposes only. Past performance is not indicative of future results.
placeholder
Gold Price Forecast: XAU/USD drifts higher above $4,200 as Fed delivers expected cutGold price (XAU/USD) gains momentum to around $4,235 during the early Asian session on Thursday. The precious metal extends its upside after the US Federal Reserve (Fed) delivered an expected third consecutive interest rate cut and maintained its outlook for just one cut in 2026.
Author  FXStreet
Dec 11, Thu
Gold price (XAU/USD) gains momentum to around $4,235 during the early Asian session on Thursday. The precious metal extends its upside after the US Federal Reserve (Fed) delivered an expected third consecutive interest rate cut and maintained its outlook for just one cut in 2026.
placeholder
Ethereum Price Slips Lower — $3,000 Looms as the Key BattlegroundEthereum is attempting to recover from a $3,026 low but remains below $3,200 and the 100-hour SMA, with a bearish trend line near $3,175 capping rebounds as bulls need a clean break above $3,200 to target $3,250–$3,400, while a drop below $3,050 risks a retest of $3,000 and $2,940.
Author  Mitrade
Dec 15, Mon
Ethereum is attempting to recover from a $3,026 low but remains below $3,200 and the 100-hour SMA, with a bearish trend line near $3,175 capping rebounds as bulls need a clean break above $3,200 to target $3,250–$3,400, while a drop below $3,050 risks a retest of $3,000 and $2,940.
placeholder
Bitcoin Slides 5% as Sellers Lean In — Can BTC Reclaim $88,000?Bitcoin has dropped back below $88,000 after rolling over from $90,500, with price still trading under the 100-hour Simple Moving Average. The sell-off found a floor at $85,151, and BTC is now consolidating near that base, but rebounds are facing pressure from a bearish trend line around $89,000. Bulls need to retake $88,000–$89,000 to ease downside risk; failure to do so keeps $85,500–$85,000 and then $83,500 in play, with $80,000 as the deeper “line in the sand.” Bitcoin (BTC) is back in damage-control mode after a sharp pullback wiped out recent gains. The price failed to reclaim the $90,000–$90,500 band, rolled over, and slid through $88,500 before briefly dipping under $87,000. Buyers did show up around $85,000, but the rebound so far looks more like stabilization than a clear trend reversal. Bitcoin dips hard, finds a bid near $85,000(h3) BTC’s latest move lower began when it couldn’t build follow-through above $90,000 and $90,500. Once that upside stalled, sellers took control and pushed price down through $88,500. The slide accelerated enough to spike below $87,000, but the market didn’t free-fall. Bulls defended the $85,000 zone, printing a low at $85,151. Since then, Bitcoin has been consolidating below the 23.6% Fibonacci retracement of the drop from the $93,560 swing high to the $85,151 low — a clue that the bounce is still shallow and that sellers haven’t fully backed off yet. Structurally, BTC is still on the back foot: It’s trading below $88,000, and It remains below the 100-hour Simple Moving Average, keeping short-term trend pressure pointed downward. Resistance is layered, and $89,000 is the problem area(h3) If bulls try to turn this into a recovery, they’ll have to climb through multiple ceilings in quick succession. First, BTC faces resistance around $87,150, followed by a more meaningful barrier near $87,500. From there, the market’s attention snaps back to $88,000 — the level BTC just lost and now needs to reclaim. A close back above $88,000 would improve the tone, but it doesn’t solve the bigger issue: there’s a bearish trend line on the hourly BTC/USD chart (Kraken feed) with resistance near $89,000, which also lines up with the next technical hurdle. If BTC can push through $89,000 and hold, the rebound could extend toward $90,000, with follow-through targets at $91,000 and $91,500. But until price clears that $88,000–$89,000 zone, rallies are at risk of being sold rather than chased. If BTC fails to reclaim resistance, the downside path is clear(h3) The near-term bear case is simple: if Bitcoin can’t climb back above the $87,000 area and keep traction, sellers may attempt another leg lower. Support levels line up like this: Immediate support: $85,500 First major support: $85,000 Next support: $83,500 Then $82,500 in the near term Below that, the major “don’t break this” level is still $80,000. If BTC slips under $80,000, the risk of acceleration to the downside increases significantly — not because it’s magic, but because it’s the kind of psychological and structural level that tends to trigger forced de-risking. Indicators: momentum still leans bearish(h3) The intraday indicators aren’t offering much comfort yet: Hourly MACD is losing pace in the bearish zone. Hourly RSI remains below 50, suggesting sellers still have the upper hand on short timeframes. So while the $85,000 defense held for now, the market hasn’t flipped bullish — it’s just stopped bleeding.
Author  Mitrade
Dec 16, Tue
Bitcoin has dropped back below $88,000 after rolling over from $90,500, with price still trading under the 100-hour Simple Moving Average. The sell-off found a floor at $85,151, and BTC is now consolidating near that base, but rebounds are facing pressure from a bearish trend line around $89,000. Bulls need to retake $88,000–$89,000 to ease downside risk; failure to do so keeps $85,500–$85,000 and then $83,500 in play, with $80,000 as the deeper “line in the sand.” Bitcoin (BTC) is back in damage-control mode after a sharp pullback wiped out recent gains. The price failed to reclaim the $90,000–$90,500 band, rolled over, and slid through $88,500 before briefly dipping under $87,000. Buyers did show up around $85,000, but the rebound so far looks more like stabilization than a clear trend reversal. Bitcoin dips hard, finds a bid near $85,000(h3) BTC’s latest move lower began when it couldn’t build follow-through above $90,000 and $90,500. Once that upside stalled, sellers took control and pushed price down through $88,500. The slide accelerated enough to spike below $87,000, but the market didn’t free-fall. Bulls defended the $85,000 zone, printing a low at $85,151. Since then, Bitcoin has been consolidating below the 23.6% Fibonacci retracement of the drop from the $93,560 swing high to the $85,151 low — a clue that the bounce is still shallow and that sellers haven’t fully backed off yet. Structurally, BTC is still on the back foot: It’s trading below $88,000, and It remains below the 100-hour Simple Moving Average, keeping short-term trend pressure pointed downward. Resistance is layered, and $89,000 is the problem area(h3) If bulls try to turn this into a recovery, they’ll have to climb through multiple ceilings in quick succession. First, BTC faces resistance around $87,150, followed by a more meaningful barrier near $87,500. From there, the market’s attention snaps back to $88,000 — the level BTC just lost and now needs to reclaim. A close back above $88,000 would improve the tone, but it doesn’t solve the bigger issue: there’s a bearish trend line on the hourly BTC/USD chart (Kraken feed) with resistance near $89,000, which also lines up with the next technical hurdle. If BTC can push through $89,000 and hold, the rebound could extend toward $90,000, with follow-through targets at $91,000 and $91,500. But until price clears that $88,000–$89,000 zone, rallies are at risk of being sold rather than chased. If BTC fails to reclaim resistance, the downside path is clear(h3) The near-term bear case is simple: if Bitcoin can’t climb back above the $87,000 area and keep traction, sellers may attempt another leg lower. Support levels line up like this: Immediate support: $85,500 First major support: $85,000 Next support: $83,500 Then $82,500 in the near term Below that, the major “don’t break this” level is still $80,000. If BTC slips under $80,000, the risk of acceleration to the downside increases significantly — not because it’s magic, but because it’s the kind of psychological and structural level that tends to trigger forced de-risking. Indicators: momentum still leans bearish(h3) The intraday indicators aren’t offering much comfort yet: Hourly MACD is losing pace in the bearish zone. Hourly RSI remains below 50, suggesting sellers still have the upper hand on short timeframes. So while the $85,000 defense held for now, the market hasn’t flipped bullish — it’s just stopped bleeding.
placeholder
December Santa Claus Rally: New highs in sight for US and European stocks?Historical data show a rising trend of US and European stocks in December. If the momentum is strong, fund managers may rush in with a buying frenzy.
Author  Mitrade
Yesterday 02: 50
Historical data show a rising trend of US and European stocks in December. If the momentum is strong, fund managers may rush in with a buying frenzy.
placeholder
XRP’s Price Action Flashes a Warning Even as ETF Flows Stay PositiveXRP’s structure remains weak despite 18 straight positive closes in spot XRP ETFs, with analysts warning that $1.98 and other nearby resistance zones could cap rebounds unless the YO region is reclaimed, while deeper downside scenarios keep $1.53 on watch as a potential (not guaranteed) accumulation area.
Author  Mitrade
Yesterday 06: 37
XRP’s structure remains weak despite 18 straight positive closes in spot XRP ETFs, with analysts warning that $1.98 and other nearby resistance zones could cap rebounds unless the YO region is reclaimed, while deeper downside scenarios keep $1.53 on watch as a potential (not guaranteed) accumulation area.
goTop
quote