U.S. Payrolls Rebound Masks Cooling Labor Market as Unemployment Hits Four-Year High

Source Tradingkey

TradingKey – The U.S. labor market delivered a mixed message in November 2025, with job growth topping estimates but unemployment surging to a multi-year high. Non-farm payrolls increased by 64,000, slightly surpassing the market forecast of 50,000 and ending the significant negative growth of the prior month. However, the unemployment rate unexpectedly jumped to 4.6%, the highest level recorded since September 2021.

Market observers noted that while the report averted the worst-case scenario, the clear cooling trend in the labor market introduces new variables for the Federal Reserve's rate-cutting path.

The core positive signal from the report stemmed from a modest rebound in the private sector, which added 69,000 jobs in November. However, the underlying concerns within the report drew more attention, as the unemployment rate surged from 4.4% in the previous month to 4.6%.

non-form-a-64070812299e496394507dc0b9d0581c

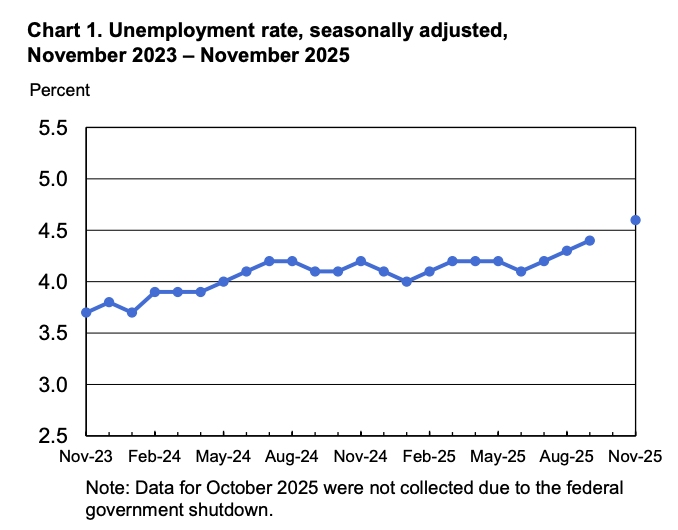
【U.S. Unemployment Rate Hits New Multi-Year High in November, Source: BLS】

Further amplifying these concerns is the deterioration in employment structure. An industry breakdown reveals that new jobs were primarily concentrated in healthcare, construction, and social assistance, reflecting continued labor absorption in service-oriented and infrastructure-related sectors. Conversely, federal government employment saw sustained declines, with a cumulative reduction of approximately 168,000 positions in October and November, significantly dragging down the overall labor market performance.

non-form-b-dc170bb078554e729cc1d1969f63ea9b

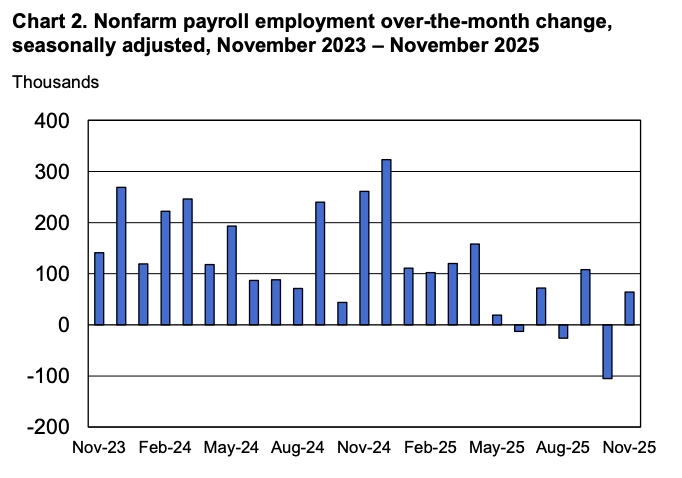
【U.S. Employment Rebounds, Source: BLS】

Wage growth also slowed notably, with average hourly earnings year-over-year growth falling to 3.5% in November, its lowest since May 2021. With inflation not yet fully subdued, weakening real wage growth could curb consumer spending among middle-to-lower income groups, thereby exacerbating downside risks to the economy.

Data Distortion Issues constituted another significant uncertainty in this report. The U.S. government shutdown led to reduced survey response rates and unusual weight adjustments, prompting the Bureau of Labor Statistics (BLS) to use a two-month analysis period with higher-than-usual standard errors. Federal Reserve Chair Jerome Powell had previously warned that non-farm payroll data might systematically overstate monthly job gains by approximately 60,000.

If this bias were excluded, actual job growth since May of this year could be near zero or even negative. This implies the labor market might already be in a hidden recession, far more severe than the surface numbers suggest.

Wall Street's interpretation of the report was divided, but the prevailing view leaned towardscautious optimism.

Krishna Guha, Head of Global Policy and Central Bank Strategy at Evercore ISI, opined that the data's weakness was insufficient to prompt the Federal Reserve to restart rate cuts in the short term, stating that onlyreadings significantly below expectationswould trigger more aggressive action.

Capital Economics economist Stephen Brown also commented that the report was "not enough for the Federal Open Market Committee to consider rate cuts at its next few meetings."

Nick Timiraos, widely considered the Fed's unofficial mouthpiece, offered a more balanced assessment: current hiring weakness is sufficient to support Powell's recent push for three rate cuts, but it hasn't deteriorated enough to necessitate action in January, particularly given thenoise stemming from the government shutdown.

Some analysts, however, adopted a moredovish stance.

Joe Brusuelas, Chief Economist at RSM, indicated that the non-farm payroll data would likelybolster the Federal Reserve's dovish faction. He noted that in the later stages of an economic cycle, the BLS often overestimates employment, subsequently revising initial figures downwards through benchmark revisions. If January's data continues to show weakness, the door for rate cuts would open rapidly.

From a deeper analytical perspective, thismixed non-farm payroll reportreflects a U.S. economy at a critical turning point.

The Federal Reserve has already implemented three consecutive rate cuts, guidingrates into a neutral range, aimed at preventing excessive weakness in the labor market. Powell has repeatedly stressed that the policy objective is to achieve stable unemployment or, at most, a slight increase of one to two tenths of a percentage point.

However, downside risks are accumulating: if job losses in manufacturing and government sectors spread, combined with slowing wage growth and deteriorating job quality, it could trigger a chain reaction in consumption and investment, leading to a further deceleration in growth.

While resilience in certain areas of the private sector provides a buffer, the structural issues within the employment composition cannot be ignored. Furthermore, the displacement effect of AI technology on middle and low-skilled jobs may become more evident in the coming months, therebyamplifying hiring caution. If the December jobs report fails to provide a"noise-free" signal of stabilization, another upward surge in the unemployment rate is not impossible, at which point the Federal Reserve might beforced to accelerate its easing paceto avert a hard landing.

Market reactions also reflected this uncertainty. Following the report's release, U.S. equity futures turned positive in pre-market trading, with the technology sector leading the rebound, while 10-year Treasury yields pulled back slightly, indicating investors were wavering between defensive positioning and risk appetite.

FED-CUT-RATE-9539e6803e924cd6a335488c359e5fc7

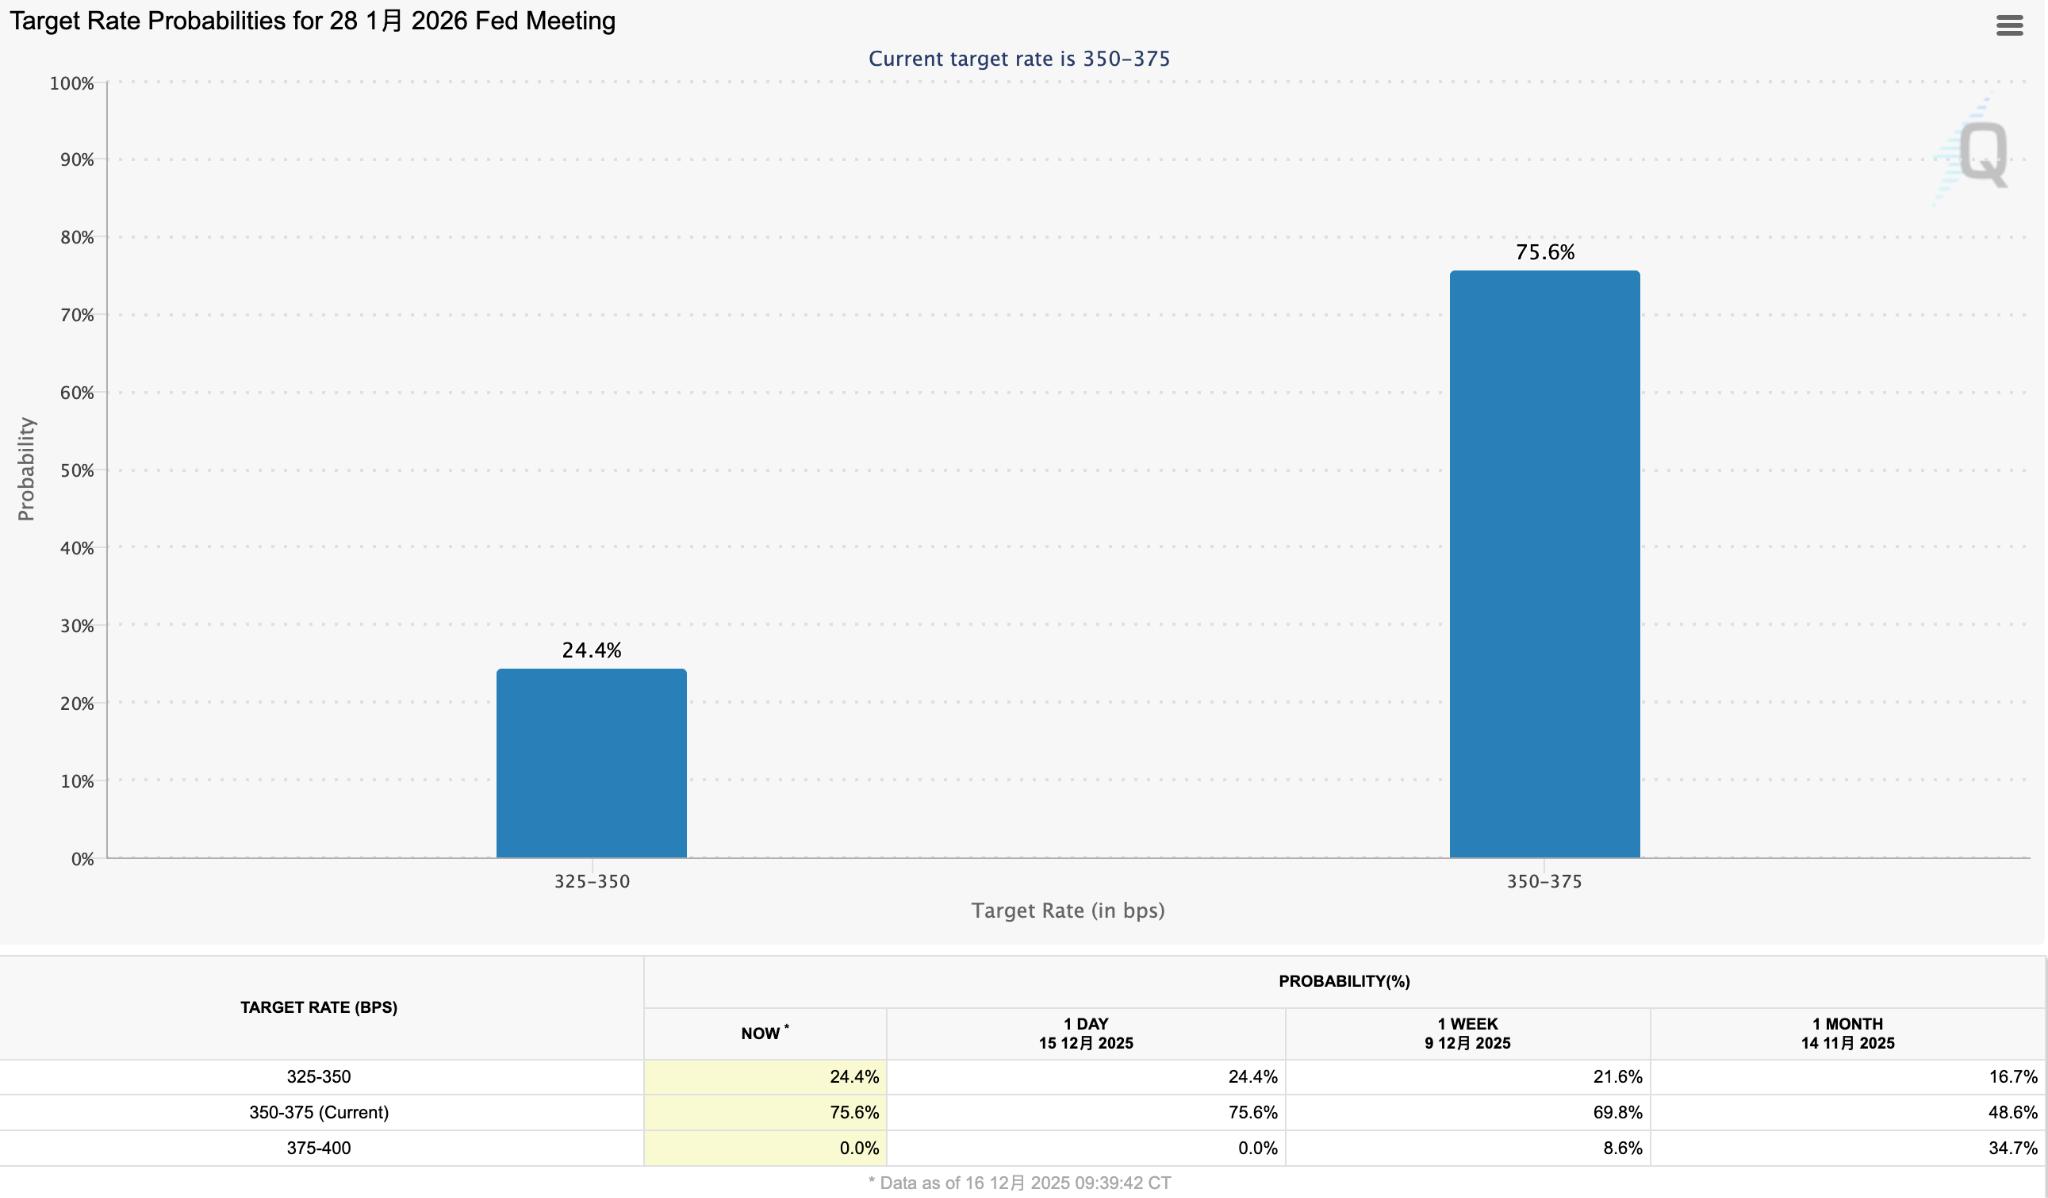
【Probability of January Rate Cut, Source: cmegroup.com】

CME Group's FedWatch Tool indicated that the probability of a January rate cut remained around 25%, a slight increase from the previous day.

Goldman Sachs strategist Chris Hussey noted that investors' interpretations of the data diverged, with falling bond yields signaling defensive postures, while the strength in tech stocks might suggest the market is betting on easing prospects.

Overall, while November's non-farm payroll data showed a modest improvement, it largely failed to mask the underlying cooling in the labor market. It provides the Federal Reserve room for gradual easing but is insufficient to pinpoint the timing of the next rate cut.

Market attention will now focus on the December and January employment readings, which will serve as a decisive test. If private sector hiring continues to stabilize, the Fed might opt to observe, prioritizing a sustained return of inflation to target. Conversely, if the unemployment rate rises further or job gains remain sluggish, rate cut expectations will quickly escalate.

Disclaimer: For information purposes only. Past performance is not indicative of future results.
placeholder
Gold Price Forecast: XAU/USD drifts higher above $4,200 as Fed delivers expected cutGold price (XAU/USD) gains momentum to around $4,235 during the early Asian session on Thursday. The precious metal extends its upside after the US Federal Reserve (Fed) delivered an expected third consecutive interest rate cut and maintained its outlook for just one cut in 2026.
Author  FXStreet
Dec 11, Thu
Gold price (XAU/USD) gains momentum to around $4,235 during the early Asian session on Thursday. The precious metal extends its upside after the US Federal Reserve (Fed) delivered an expected third consecutive interest rate cut and maintained its outlook for just one cut in 2026.
placeholder
Ethereum Price Slips Lower — $3,000 Looms as the Key BattlegroundEthereum is attempting to recover from a $3,026 low but remains below $3,200 and the 100-hour SMA, with a bearish trend line near $3,175 capping rebounds as bulls need a clean break above $3,200 to target $3,250–$3,400, while a drop below $3,050 risks a retest of $3,000 and $2,940.
Author  Mitrade
Dec 15, Mon
Ethereum is attempting to recover from a $3,026 low but remains below $3,200 and the 100-hour SMA, with a bearish trend line near $3,175 capping rebounds as bulls need a clean break above $3,200 to target $3,250–$3,400, while a drop below $3,050 risks a retest of $3,000 and $2,940.
placeholder
Macro Analysts: Hawkish Japan Could Push Bitcoin Below $70KAnalysts predict Bitcoin may face further declines towards the $70,000 mark if the Bank of Japan raises interest rates as expected.
Author  Mitrade
Dec 15, Mon
Analysts predict Bitcoin may face further declines towards the $70,000 mark if the Bank of Japan raises interest rates as expected.
placeholder
Bitcoin Slides 5% as Sellers Lean In — Can BTC Reclaim $88,000?Bitcoin has dropped back below $88,000 after rolling over from $90,500, with price still trading under the 100-hour Simple Moving Average. The sell-off found a floor at $85,151, and BTC is now consolidating near that base, but rebounds are facing pressure from a bearish trend line around $89,000. Bulls need to retake $88,000–$89,000 to ease downside risk; failure to do so keeps $85,500–$85,000 and then $83,500 in play, with $80,000 as the deeper “line in the sand.” Bitcoin (BTC) is back in damage-control mode after a sharp pullback wiped out recent gains. The price failed to reclaim the $90,000–$90,500 band, rolled over, and slid through $88,500 before briefly dipping under $87,000. Buyers did show up around $85,000, but the rebound so far looks more like stabilization than a clear trend reversal. Bitcoin dips hard, finds a bid near $85,000(h3) BTC’s latest move lower began when it couldn’t build follow-through above $90,000 and $90,500. Once that upside stalled, sellers took control and pushed price down through $88,500. The slide accelerated enough to spike below $87,000, but the market didn’t free-fall. Bulls defended the $85,000 zone, printing a low at $85,151. Since then, Bitcoin has been consolidating below the 23.6% Fibonacci retracement of the drop from the $93,560 swing high to the $85,151 low — a clue that the bounce is still shallow and that sellers haven’t fully backed off yet. Structurally, BTC is still on the back foot: It’s trading below $88,000, and It remains below the 100-hour Simple Moving Average, keeping short-term trend pressure pointed downward. Resistance is layered, and $89,000 is the problem area(h3) If bulls try to turn this into a recovery, they’ll have to climb through multiple ceilings in quick succession. First, BTC faces resistance around $87,150, followed by a more meaningful barrier near $87,500. From there, the market’s attention snaps back to $88,000 — the level BTC just lost and now needs to reclaim. A close back above $88,000 would improve the tone, but it doesn’t solve the bigger issue: there’s a bearish trend line on the hourly BTC/USD chart (Kraken feed) with resistance near $89,000, which also lines up with the next technical hurdle. If BTC can push through $89,000 and hold, the rebound could extend toward $90,000, with follow-through targets at $91,000 and $91,500. But until price clears that $88,000–$89,000 zone, rallies are at risk of being sold rather than chased. If BTC fails to reclaim resistance, the downside path is clear(h3) The near-term bear case is simple: if Bitcoin can’t climb back above the $87,000 area and keep traction, sellers may attempt another leg lower. Support levels line up like this: Immediate support: $85,500 First major support: $85,000 Next support: $83,500 Then $82,500 in the near term Below that, the major “don’t break this” level is still $80,000. If BTC slips under $80,000, the risk of acceleration to the downside increases significantly — not because it’s magic, but because it’s the kind of psychological and structural level that tends to trigger forced de-risking. Indicators: momentum still leans bearish(h3) The intraday indicators aren’t offering much comfort yet: Hourly MACD is losing pace in the bearish zone. Hourly RSI remains below 50, suggesting sellers still have the upper hand on short timeframes. So while the $85,000 defense held for now, the market hasn’t flipped bullish — it’s just stopped bleeding.
Author  Mitrade
Yesterday 02: 56
Bitcoin has dropped back below $88,000 after rolling over from $90,500, with price still trading under the 100-hour Simple Moving Average. The sell-off found a floor at $85,151, and BTC is now consolidating near that base, but rebounds are facing pressure from a bearish trend line around $89,000. Bulls need to retake $88,000–$89,000 to ease downside risk; failure to do so keeps $85,500–$85,000 and then $83,500 in play, with $80,000 as the deeper “line in the sand.” Bitcoin (BTC) is back in damage-control mode after a sharp pullback wiped out recent gains. The price failed to reclaim the $90,000–$90,500 band, rolled over, and slid through $88,500 before briefly dipping under $87,000. Buyers did show up around $85,000, but the rebound so far looks more like stabilization than a clear trend reversal. Bitcoin dips hard, finds a bid near $85,000(h3) BTC’s latest move lower began when it couldn’t build follow-through above $90,000 and $90,500. Once that upside stalled, sellers took control and pushed price down through $88,500. The slide accelerated enough to spike below $87,000, but the market didn’t free-fall. Bulls defended the $85,000 zone, printing a low at $85,151. Since then, Bitcoin has been consolidating below the 23.6% Fibonacci retracement of the drop from the $93,560 swing high to the $85,151 low — a clue that the bounce is still shallow and that sellers haven’t fully backed off yet. Structurally, BTC is still on the back foot: It’s trading below $88,000, and It remains below the 100-hour Simple Moving Average, keeping short-term trend pressure pointed downward. Resistance is layered, and $89,000 is the problem area(h3) If bulls try to turn this into a recovery, they’ll have to climb through multiple ceilings in quick succession. First, BTC faces resistance around $87,150, followed by a more meaningful barrier near $87,500. From there, the market’s attention snaps back to $88,000 — the level BTC just lost and now needs to reclaim. A close back above $88,000 would improve the tone, but it doesn’t solve the bigger issue: there’s a bearish trend line on the hourly BTC/USD chart (Kraken feed) with resistance near $89,000, which also lines up with the next technical hurdle. If BTC can push through $89,000 and hold, the rebound could extend toward $90,000, with follow-through targets at $91,000 and $91,500. But until price clears that $88,000–$89,000 zone, rallies are at risk of being sold rather than chased. If BTC fails to reclaim resistance, the downside path is clear(h3) The near-term bear case is simple: if Bitcoin can’t climb back above the $87,000 area and keep traction, sellers may attempt another leg lower. Support levels line up like this: Immediate support: $85,500 First major support: $85,000 Next support: $83,500 Then $82,500 in the near term Below that, the major “don’t break this” level is still $80,000. If BTC slips under $80,000, the risk of acceleration to the downside increases significantly — not because it’s magic, but because it’s the kind of psychological and structural level that tends to trigger forced de-risking. Indicators: momentum still leans bearish(h3) The intraday indicators aren’t offering much comfort yet: Hourly MACD is losing pace in the bearish zone. Hourly RSI remains below 50, suggesting sellers still have the upper hand on short timeframes. So while the $85,000 defense held for now, the market hasn’t flipped bullish — it’s just stopped bleeding.
placeholder
December Santa Claus Rally: New highs in sight for US and European stocks?Historical data show a rising trend of US and European stocks in December. If the momentum is strong, fund managers may rush in with a buying frenzy.
Author  Mitrade
5 hours ago
Historical data show a rising trend of US and European stocks in December. If the momentum is strong, fund managers may rush in with a buying frenzy.
goTop
quote