

Mexican Peso extends uptrend to almost nine-year lows against USD
- The Mexican Peso continues rising to almost nine-year highs against the US Dollar (USD).
- Mexican inflation data for March is scheduled for release on Tuesday and could cause volatility for the Peso.
- A higher-than-expected reading would indicate interest rates remaining elevated, increasing demand for MXN.
The Mexican Peso (MXN) is trading at eight almost nine-year highs below 16.30 against the US Dollar (USD) on Tuesday, as it continues its long-term bull trend.
The next major release for the pair is Mexican inflation data for March, which will be released at 12.00 GMT and is likely to influence the outlook for interest rates in the country, a key driver of foreign exchange valuations.
Mexican Peso rallies ahead of CPI data
The Mexican Peso will probably be impacted if the Mexican inflation rate deviates significantly from analyst’s expectations.
Mexican Headline Inflation is expected to rise by 0.36% MoM in March after registering a 0.09% rise in February.
Core Inflation is forecast to rise 0.51% after a 0.49% increase in February.
The Mexican Peso is likely to appreciate if inflation is hotter-than-expected since this will mean the Banco de Mexico (Banxico) will have to keep interest rates higher for longer. Higher interest rates tend to increase demand for a currency as they attract higher foreign capital inflows.
The bank reduced interest rates from 11.25% to 11.00% at its March meeting after seeing a gradual decline in inflation, however, the meeting minutes made it clear that future decisions will be data-dependent, and that the overall outlook for inflation remains elevated.
Technical Analysis: USD/MXN quickens downtrend
USD/MXN has quickened the pace of its long-term downtrend. The trend started after the pair peaked at 25.76 in April 2020 – it has now fallen to the 16.20s. Since “the trend is your friend,” it is likely to extend.
The pair is probably unfolding a large three-wave Measured Move pattern. These are composed of an A, B, and C wave, with wave C extending to a similar length to wave A, or a Fibonacci 0.618 ratio of A.
USD/MXN Weekly Chart
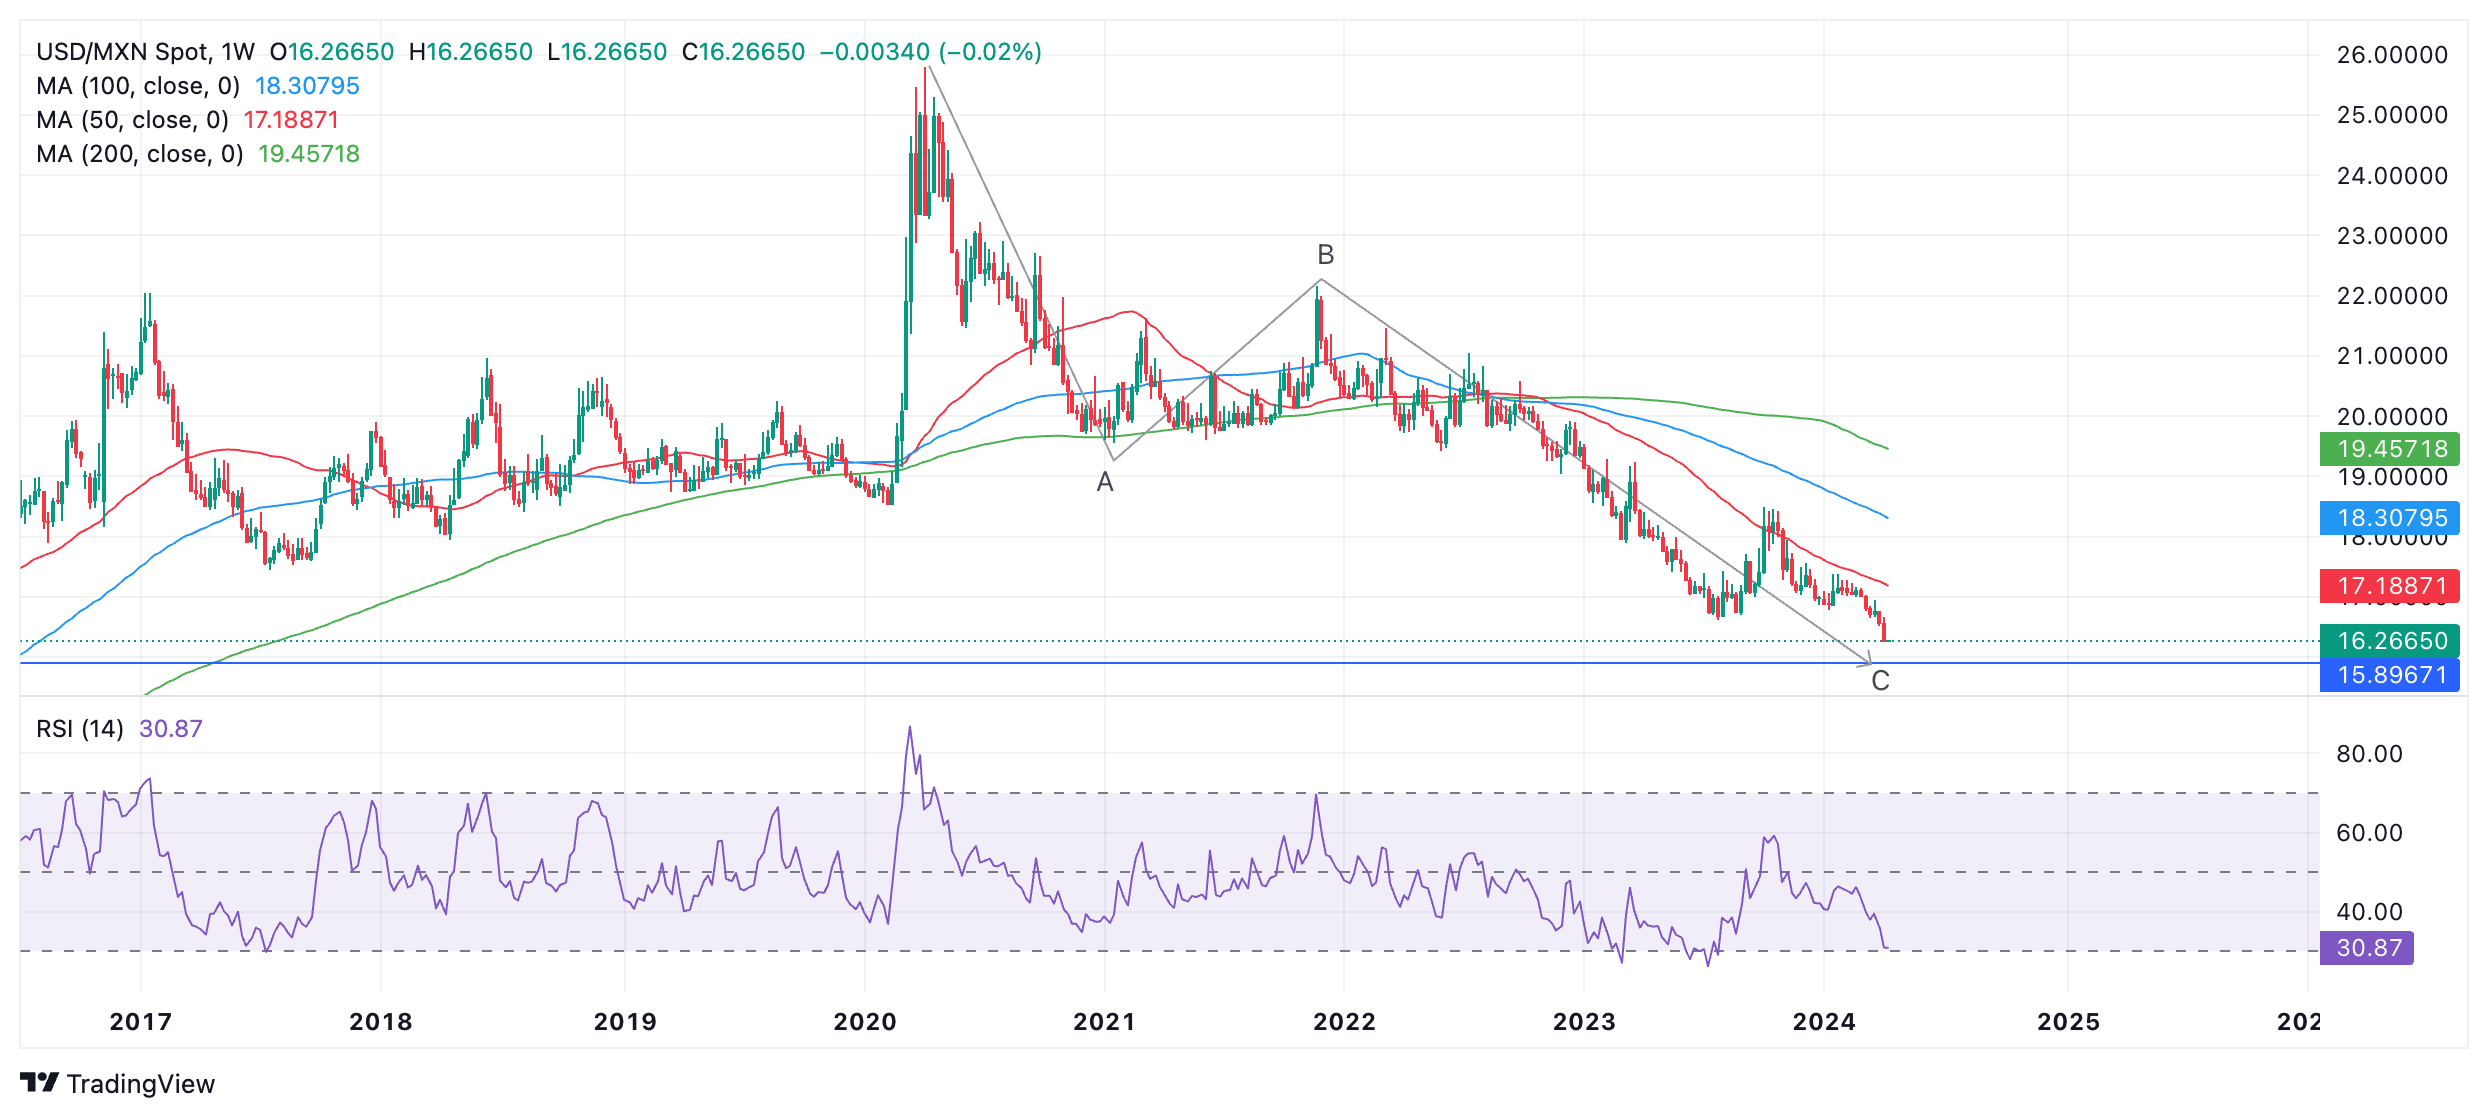
If this is the case, price has almost reached the point at which C will equal A, calculated as lying at 15.89.
It has also by now surpassed the conservative target for the end of C at the 0.618 Fibonacci extension of A (at 18.24).
Once the pattern is complete the market usually reverses or undergoes a substantial correction.
The Relative Strength Index (RSI) is converging acutely with price – a sign the downtrend could be losing momentum. USD/MXN has pushed lower than the 2023 lows but RSI has not followed suit. This non-correlation is a bullish indication. It could lead to a correction higher eventually.
There has been no reaction from price yet, however, so the expectation of upside remains speculatory and unconfirmed.
Economic Indicator
Core Inflation
The core inflation index released by the Bank of Mexico is a measure of price movements by the comparison between the retail prices of a representative shopping basket of goods and services, excluding taxes and energy. The purchase power of Mexican Peso is dragged down by inflation. The inflation index is a key indicator since it is used by the central bank to set interest rates. Generally speaking, a high reading is seen as positive (or bullish) for the Mexican Peso, while a low reading is seen as negative (or Bearish).
Read more.Next release: Tue Apr 09, 2024 12:00
Frequency: Monthly
Consensus: 0.51%
Previous: 0.49%
Source: National Institute of Statistics and Geography of Mexico
Recommended Articles


