
US Dollar extends trade-driven rally as markets await key US economic data
- The US Dollar is holding firm after its strongest daily gain since May, fueled by the US-EU trade agreement.
- The Dollar Index (DXY) is up over 2.0% in July, on pace for its first monthly gain since December.
- Traders await key economic releases on Tuesday, including Consumer Confidence and JOLTS Job Openings data.
The US Dollar (USD) is holding firm on Tuesday after posting its strongest single-day gain since May, rallying 1.0% on Monday. The rally came after the United States (US) and European Union (EU) announced a major trade deal framework on Sunday. Markets welcomed the news, seeing the agreement heavily tilted in favor of Washington. Investors are betting the deal gives the US more economic and strategic power, boosting confidence in the Greenback.
The US Dollar Index (DXY), which measures the Greenback against a basket of six major currencies, is consolidating Monday’s strong gains during the European trading hours. As of now, the index is hovering around 98.89, down slightly from the intraday peak of 99.05 reached during Asian trading — the highest level since June 23.
The US Dollar Index hit its lowest level in over three years on July 1, dropping to 96.38. Since then, it has been steadily recovering and is now on track for its first monthly gain since February, rising over 2.0% so far this month. The rebound has been fueled by easing trade tensions ahead of the August 1 deadline, with new agreements reached with major partners like the EU and Japan, as well as smaller economies including Indonesia, the Philippines, and Vietnam. Robust US economic data has also played a key role, reducing expectations of an interest rate cut by the Federal Reserve (Fed) on Wednesday and adding further support to the US Dollar.
Looking ahead, Tuesday’s US economic calendar will be closely watched, featuring the Housing Price Index, Consumer Confidence data, and the JOLTS Job Openings report. Consumer Confidence index is expected to improve to a two-month high at 96.0 compared to 93.0 in June. The June JOLTS survey is expected to show around 7.5 million job openings, offering fresh insight into labor market conditions. These releases could further shape the next move of the US Dollar ahead of the Fed monetary policy decision on Wednesday, especially if they continue to point to underlying strength in the US economy.
Market Movers: Trade optimism lifts the US Dollar
- The newly announced US-EU trade deal is a major driver of the US Dollar’s rally this week. Unveiled on Sunday, the agreement averted a potentially damaging tariff standoff and delivered significant concessions to Washington. Under the deal, the US will impose a baseline 15% tariff on most EU imports, far lower than the 30% originally threatened, but still above the 10% baseline tariffs. Strategic goods such as aircraft components, semiconductors, and certain pharmaceutical and agricultural products received exemptions, preserving key supply chains. In return, the EU committed to purchasing $750 billion in US energy, primarily Liquefied Natural Gas (LNG), over the next three years, and pledged an additional $600 billion in long-term investment into the US economy. These moves are seen as enhancing the US's economic leverage while deepening transatlantic ties.
- The $600 billion will come entirely from private funds. According to both European Commission (EC) Commerce Commissioner Maroš Šefčovič and EC officials speaking to Politico, the European Commission will play no role in reaching the $600 billion, and the amount will come from private companies. This differs significantly from the Japanese deal, where the government-backed organisations will lead the administration of their investment.
- Earlier in the month, the US-Japan trade agreement took center stage, which cut previously proposed auto tariffs from 27.5% to 15%, while Japan pledged an unprecedented $550 billion investment package in the US to support critical sectors like semiconductors, energy, pharmaceuticals, shipbuilding, and autos.
- Traders are keeping a close eye on the ongoing US-China trade discussions in Stockholm, which resumed today after concluding the first round of talks on Monday. Top-level officials from both sides, including US Treasury Secretary Scott Bessent and China’s Vice Premier He Lifeng, are meeting to explore an extension of the current tariff truce set to expire on August 12.
- The US Treasury has announced a massive borrowing plan for the second half of 2025, signaling $1.6 trillion in net new marketable debt — $1.007 trillion in Q3 and $590 billion in Q4. While around $500 billion of that is aimed at rebuilding the Treasury General Account (TGA) rather than new spending, the scale of issuance is putting renewed pressure on bond markets. The timing is tough, yields are already elevated across the curve. The 30-year yield is hovering near 4.96%, the 10-year at 4.41%, and even the 2-year is approaching 4%. With interest costs rising, the government is now rolling over debt at far higher rates than the near-zero levels that defined the past decade. This adds strain to the fiscal outlook and raises questions about how long the Treasury can sustain such high borrowing costs without crowding out private investment.
Technical analysis: DXY rally strengthens as RSI and MACD support further upside
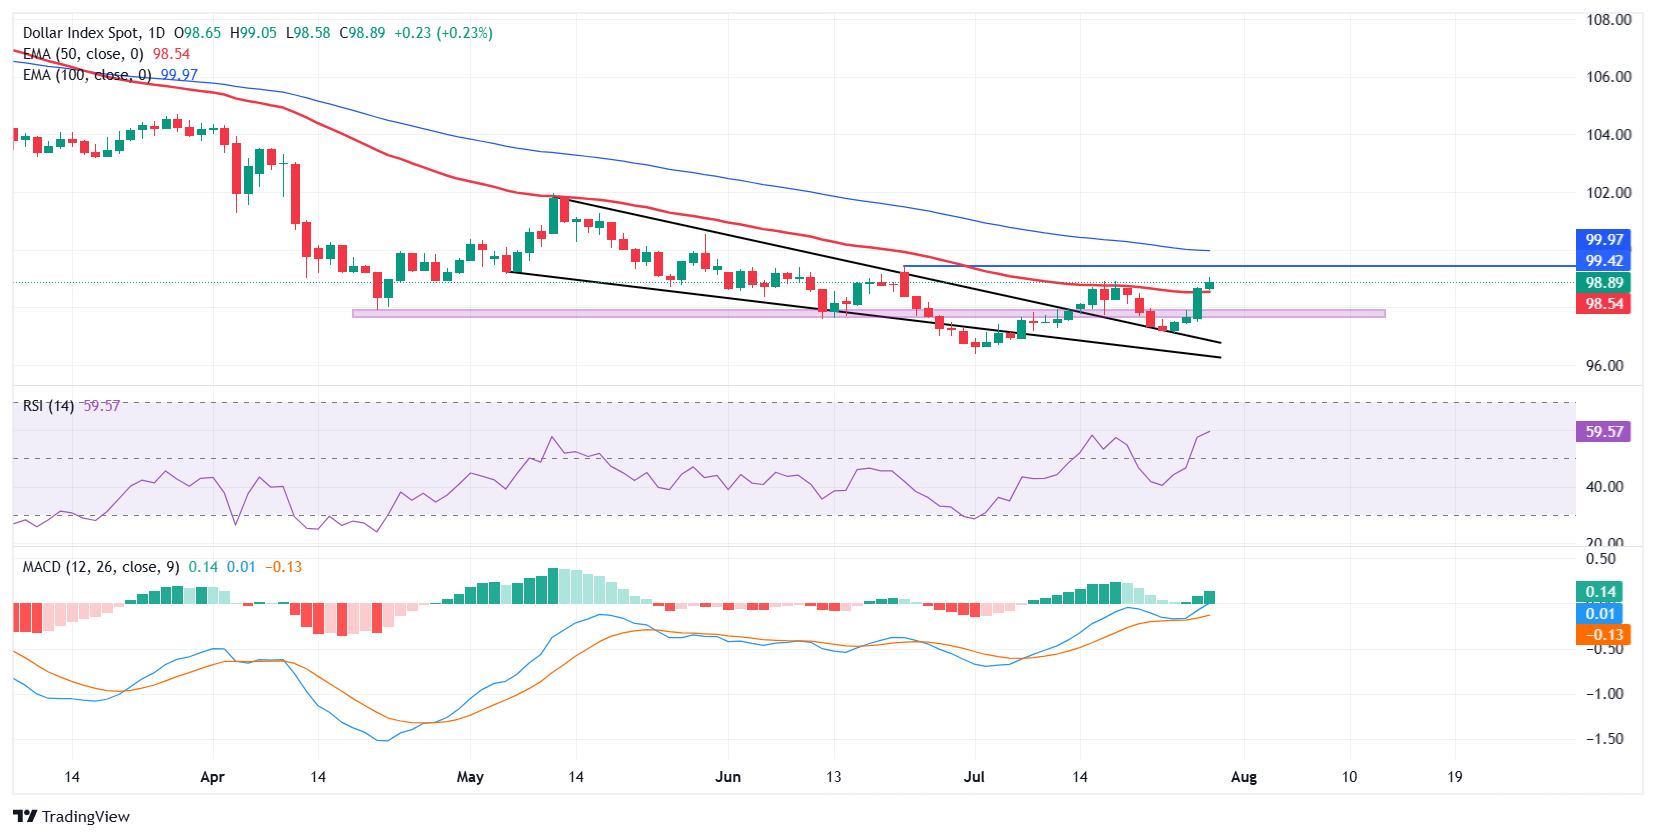
The US Dollar Index (DXY) continues to build on its bullish momentum, trading around 98.89 in Tuesday’s session. The index has extended its recovery after successfully retesting the upper boundary of a falling wedge pattern, which it broke earlier this month. The upward move is further validated by a sustained move above the 50-day Exponential Moving Average (EMA) at 98.54, now acting as immediate support, followed by the 97.80-98.00 zone. The next resistance zone lies ahead at 99.42, the high of June 23, followed by the 100-day EMA at 99.97. A successful hold above 98.50, which aligns closely with the 50-day EMA, would reinforce the bullish structure and keep the US Dollar Index on track to challenge the next resistance levels.
Momentum indicators support the bullish bias. The Relative Strength Index (RSI) is climbing, currently around 59, indicating growing buying strength with room for further upside before a potential exhaustion. Meanwhile, the Moving Average Convergence Divergence (MACD) indicator continues to strengthen, with both the MACD and signal lines rising and the histogram bars expanding in positive territory.
US Dollar PRICE Today
The table below shows the percentage change of US Dollar (USD) against listed major currencies today. US Dollar was the strongest against the New Zealand Dollar.
| USD | EUR | GBP | JPY | CAD | AUD | NZD | CHF | |
|---|---|---|---|---|---|---|---|---|
| USD | 0.46% | 0.14% | 0.15% | 0.26% | 0.36% | 0.50% | 0.38% | |
| EUR | -0.46% | -0.32% | -0.31% | -0.20% | -0.07% | -0.06% | -0.06% | |
| GBP | -0.14% | 0.32% | 0.00% | 0.13% | 0.25% | 0.27% | 0.25% | |
| JPY | -0.15% | 0.31% | 0.00% | 0.09% | 0.20% | 0.27% | 0.34% | |
| CAD | -0.26% | 0.20% | -0.13% | -0.09% | 0.05% | 0.25% | 0.12% | |
| AUD | -0.36% | 0.07% | -0.25% | -0.20% | -0.05% | 0.03% | -0.01% | |
| NZD | -0.50% | 0.06% | -0.27% | -0.27% | -0.25% | -0.03% | -0.02% | |
| CHF | -0.38% | 0.06% | -0.25% | -0.34% | -0.12% | 0.00% | 0.02% |
The heat map shows percentage changes of major currencies against each other. The base currency is picked from the left column, while the quote currency is picked from the top row. For example, if you pick the US Dollar from the left column and move along the horizontal line to the Japanese Yen, the percentage change displayed in the box will represent USD (base)/JPY (quote).
Recommended Articles


