

Dow Jones Industrial Average churns as investors await tariff news
- The Dow Jones found thin gains on Monday ahead of trade war headlines.
- Tech rally has stalled after last batch of earnings came in mixed.
- Fed Chair Powell back on the calendar, as well as US inflation data.
The Dow Jones Industrial Average (DJIA) found a slim foothold on Monday despite some volatility in the pre-market. The United States (US) Federal Reserve (Fed) is back in news circulation this week, with Fed Chair Jerome Powell set to testify before the US Senate Banking Committee on Tuesday. US Consumer Price Index (CPI) and Producer Price Index (PPI) inflation metrics are slated for Wednesday and Thursday, respectively.
US President Donald Trump is expected to sign another batch of sweeping executive orders on Monday afternoon. Some of those orders are expected to focus on a fresh batch of tariff threats, this time focusing on a flat import tax on all foreign-sourced steel and aluminum into the US. While a threat to US market stability, investors are largely brushing off the trade war rhetoric after President Trump functionally waffled on nearly all of his trade war threats just last week, though a tit-for-tat spat of tariffs on Chinese goods are still in place.
Fed Chair Powell’s testimony this Tuesday will be the Fed head’s first appearance before the Senate since Donald Trump took office, and questions are expected to largely focus on Trump’s tariff policies and how they impact the Fed’s decision framework. Multiple iterations of whether Fed Chair Powell will acquiesce to requests from the Trump administration, ranging from arbitrary rate adjustments at the behest of the President to whether Powell would vacate his position if asked by Donald Trump, are expected.
Key US inflation data is due this week, with US CPI inflation on Wednesday and PPI producer-level inflation slated for Thursday. The New York Fed noted on Monday that consumer inflation expectations have become anchored around the 3% level, frustratingly higher than the central bank’s 2% target. The NY Fed also highlighted an overall decline in consumer expectations of increased spending going forward, though debt-laden consumers did acknowledge an overall easing in credit access.
Dow Jones news
The Dow Jones was relatively even-keeled on Monday, with about half of the equity board in the green. American Express (AXP) fell around 3% to $307 per share after the credit company softened its earnings growth outlook for the first quarter. McDonald’s (MCD) rose nearly 4% to $306 per share on Monday despite a miss in quarterly earnings, with investors noting that the overall pace of new locations has been on the rise and is expected to contribute to aggregate earnings in 2025.
Dow Jones price forecast
The Dow Jones remains pinned near 44,350 after last week’s late bearish push. Price action remains crimped below the 45,000 handle, and momentum is getting squeezed into a middling congestion pattern.
A near-term technical floor is getting priced in at the 50-day Exponential Moving Average (EMA) near 43,750. Both bulls and bears appear to have run out of gas for the time being, but the Dow Jones is still trading close to record highs just beyond 45,000.
Dow Jones daily chart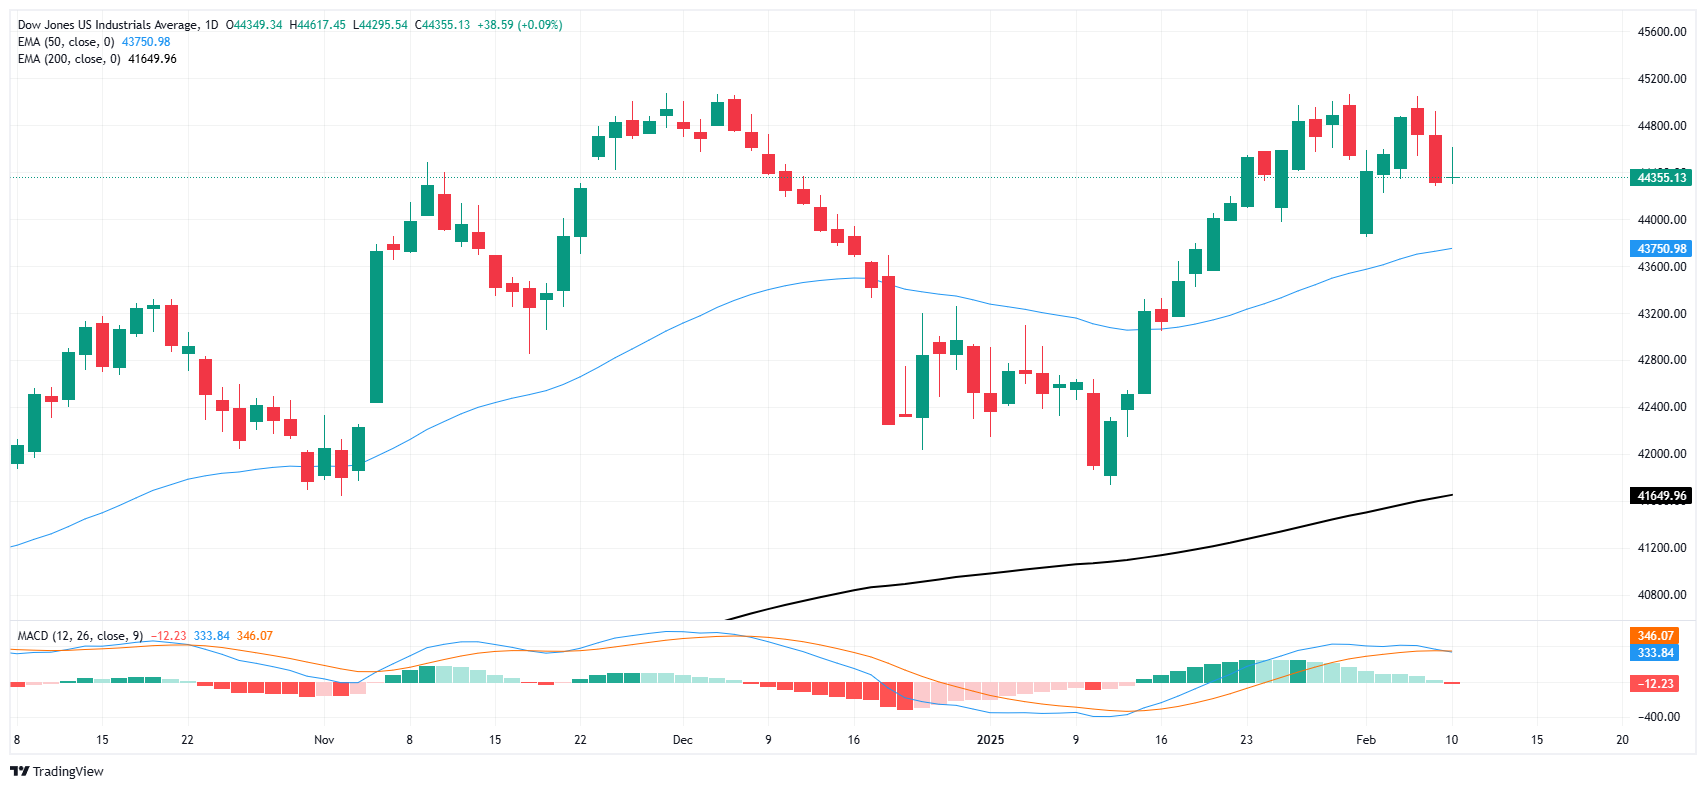
Dow Jones FAQs
The Dow Jones Industrial Average, one of the oldest stock market indices in the world, is compiled of the 30 most traded stocks in the US. The index is price-weighted rather than weighted by capitalization. It is calculated by summing the prices of the constituent stocks and dividing them by a factor, currently 0.152. The index was founded by Charles Dow, who also founded the Wall Street Journal. In later years it has been criticized for not being broadly representative enough because it only tracks 30 conglomerates, unlike broader indices such as the S&P 500.
Many different factors drive the Dow Jones Industrial Average (DJIA). The aggregate performance of the component companies revealed in quarterly company earnings reports is the main one. US and global macroeconomic data also contributes as it impacts on investor sentiment. The level of interest rates, set by the Federal Reserve (Fed), also influences the DJIA as it affects the cost of credit, on which many corporations are heavily reliant. Therefore, inflation can be a major driver as well as other metrics which impact the Fed decisions.
Dow Theory is a method for identifying the primary trend of the stock market developed by Charles Dow. A key step is to compare the direction of the Dow Jones Industrial Average (DJIA) and the Dow Jones Transportation Average (DJTA) and only follow trends where both are moving in the same direction. Volume is a confirmatory criteria. The theory uses elements of peak and trough analysis. Dow’s theory posits three trend phases: accumulation, when smart money starts buying or selling; public participation, when the wider public joins in; and distribution, when the smart money exits.
There are a number of ways to trade the DJIA. One is to use ETFs which allow investors to trade the DJIA as a single security, rather than having to buy shares in all 30 constituent companies. A leading example is the SPDR Dow Jones Industrial Average ETF (DIA). DJIA futures contracts enable traders to speculate on the future value of the index and Options provide the right, but not the obligation, to buy or sell the index at a predetermined price in the future. Mutual funds enable investors to buy a share of a diversified portfolio of DJIA stocks thus providing exposure to the overall index.
Recommended Articles


