

US equities decline after Fed’s Powell pulls the plug on March cut
- US indexes saw red on Wednesday after Fed waffled on early rate cuts.
- Market expectations of faster, sooner rate cuts ran against a hard wall.
- US Fed continues to wait for further signs that inflation will ease.
US equity indexes declined across the board on Wednesday, faltering after market hopes for a faster pace of rate cuts from the Federal Reserve (Fed) discovered just how far ahead of policymakers they’ve run. Before the Fed’s monetary policy statement and Fed chairman Jerome Powell’s press conference, money markets were pricing in nearly a 60% chance of a rate cut from the US central bank by the beginning of March.
Jerome Powell speaks on policy outlook after deciding to keep interest rate unchanged
Post-Fed, rate swaps have receded on rate trim expectations, with March priced in at 64% chance of another rate hold, but May’s Fed rate call is now fully priced in for at least 25 basis points in rate cuts according to the CME’s FedWatch Tool.
The Dow Jones Industrial Average (DJIA) trimmed 317 points to close down 0.82% at $38,150.30, with the Standard & Poor’s 500 (SP500) index shedding nearly 80 points, ending Wednesday at $4,845.65, down 1.61%.
The NASDAQ Composite equity index got hit the hardest amidst a tech sector pullback, tumbling over 345 points to end Wednesday at $15,164.01, down a blustery 2.23%.
S&P 500 technical outlook
The S&P 500 large-cap index saw it’s lowest bids in over a week, ending firmly planted in the red after falling back below the $4,900.00 handle. Intraday momentum has the SP500 geared for a downside run at the 200-hour Simple Moving Average (SMA) near $4,835.00, with the next technical support zone priced in from last week’s intraday swing highs into $4,800.00.
Despite Wednesday’s turnaround, the SP500 remains firmly planted in bull country, with the index facing its second down week out of the last 14 consecutive trading weeks, assuming investors are unable to drag the index back over Monday’s opening bids near $4,886.00 before Friday’s closing bell.
S&P 500 hourly chart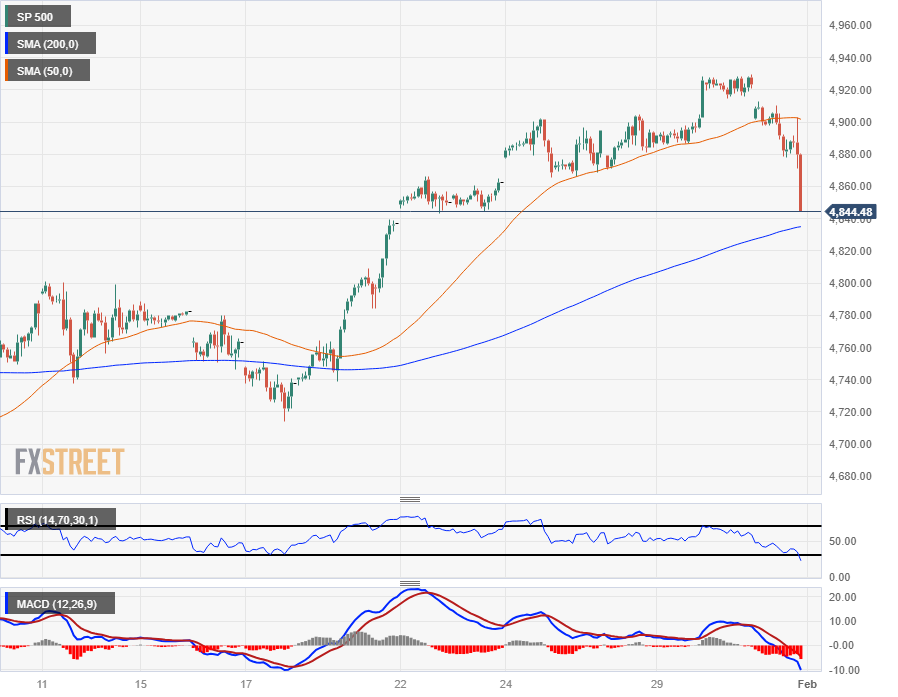
S&P 500 daily chart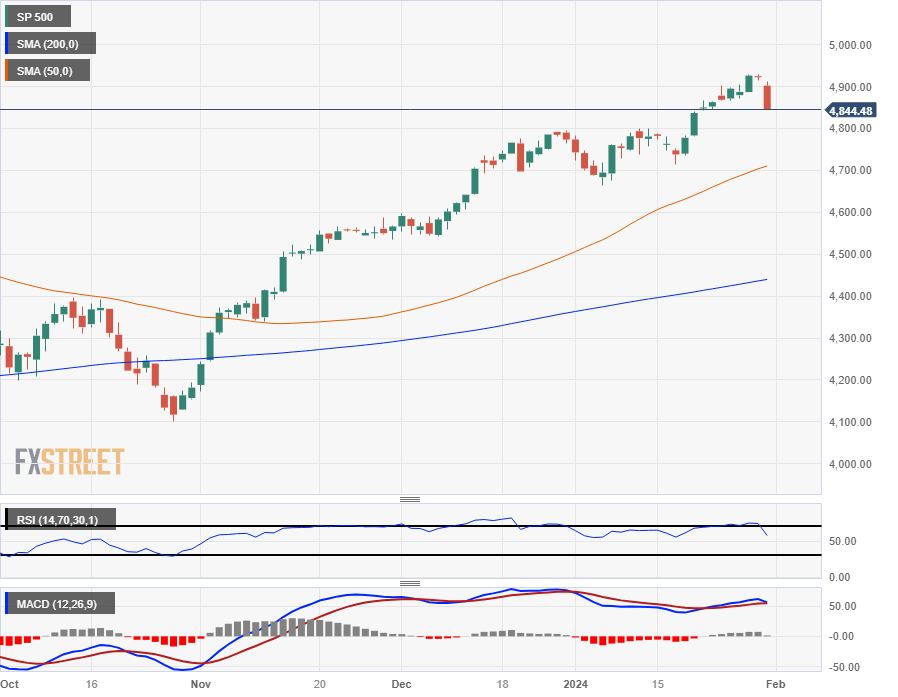
Recommended Articles


