

Dow Jones advances moderately in a cautious market mood
- Dow Jones gains while NASDAQ, S&P 500 slide.
- Geopolitical concerns have eased, but investors remain wary of risk.
- Dow Jones trend needs to break resistances at 38,105 and 38,531 to cancel the bearish bias.
The Dow Jones Industrial Average (DJIA) is trading moderately higher on Friday with Wall Street indexes mixed on looming geopolitical concerns.
News from an Israeli attack on Iran has boosted risk aversion although the Islamic Republic has downplayed the incident and showed no intention to retaliate.
The US economic calendar is light today. Chicago Federal Reserve President Austan Goolsbee reiterated the lack of progress on inflation but showed confidence that core inflation will return to the 2% level. US yields are pulling back, but uninspiring earnings reports have left markets in no man’s land.
The Dow Jones is outperforming with a 0.4% advance to 37,941, while the S&P 500 drops 0.3 % to 4,994 and the NASDAQ dives 1% to 15,439.
Dow Jones news
A majority of the Wall Street sectors are posting gains with Energy stocks leading gains thanks to a 1.2% advance, followed by Utilities, up 1.2%. On the negative side, Communication Services drops 1.6%, and Technology is down 1.4%.
American Express (UNH) rose 3.1% to $493.51 and is the best performer for the second day in a row, fuelled by the strong quarterly earnings results. Next is United Health Group (UNH) with a 2.1% gain to $503.76. On the losing end, Amazon (AMZN) drops 2.1% to $175.47, and Intel (INTC) loses 1.6% to $34.45.
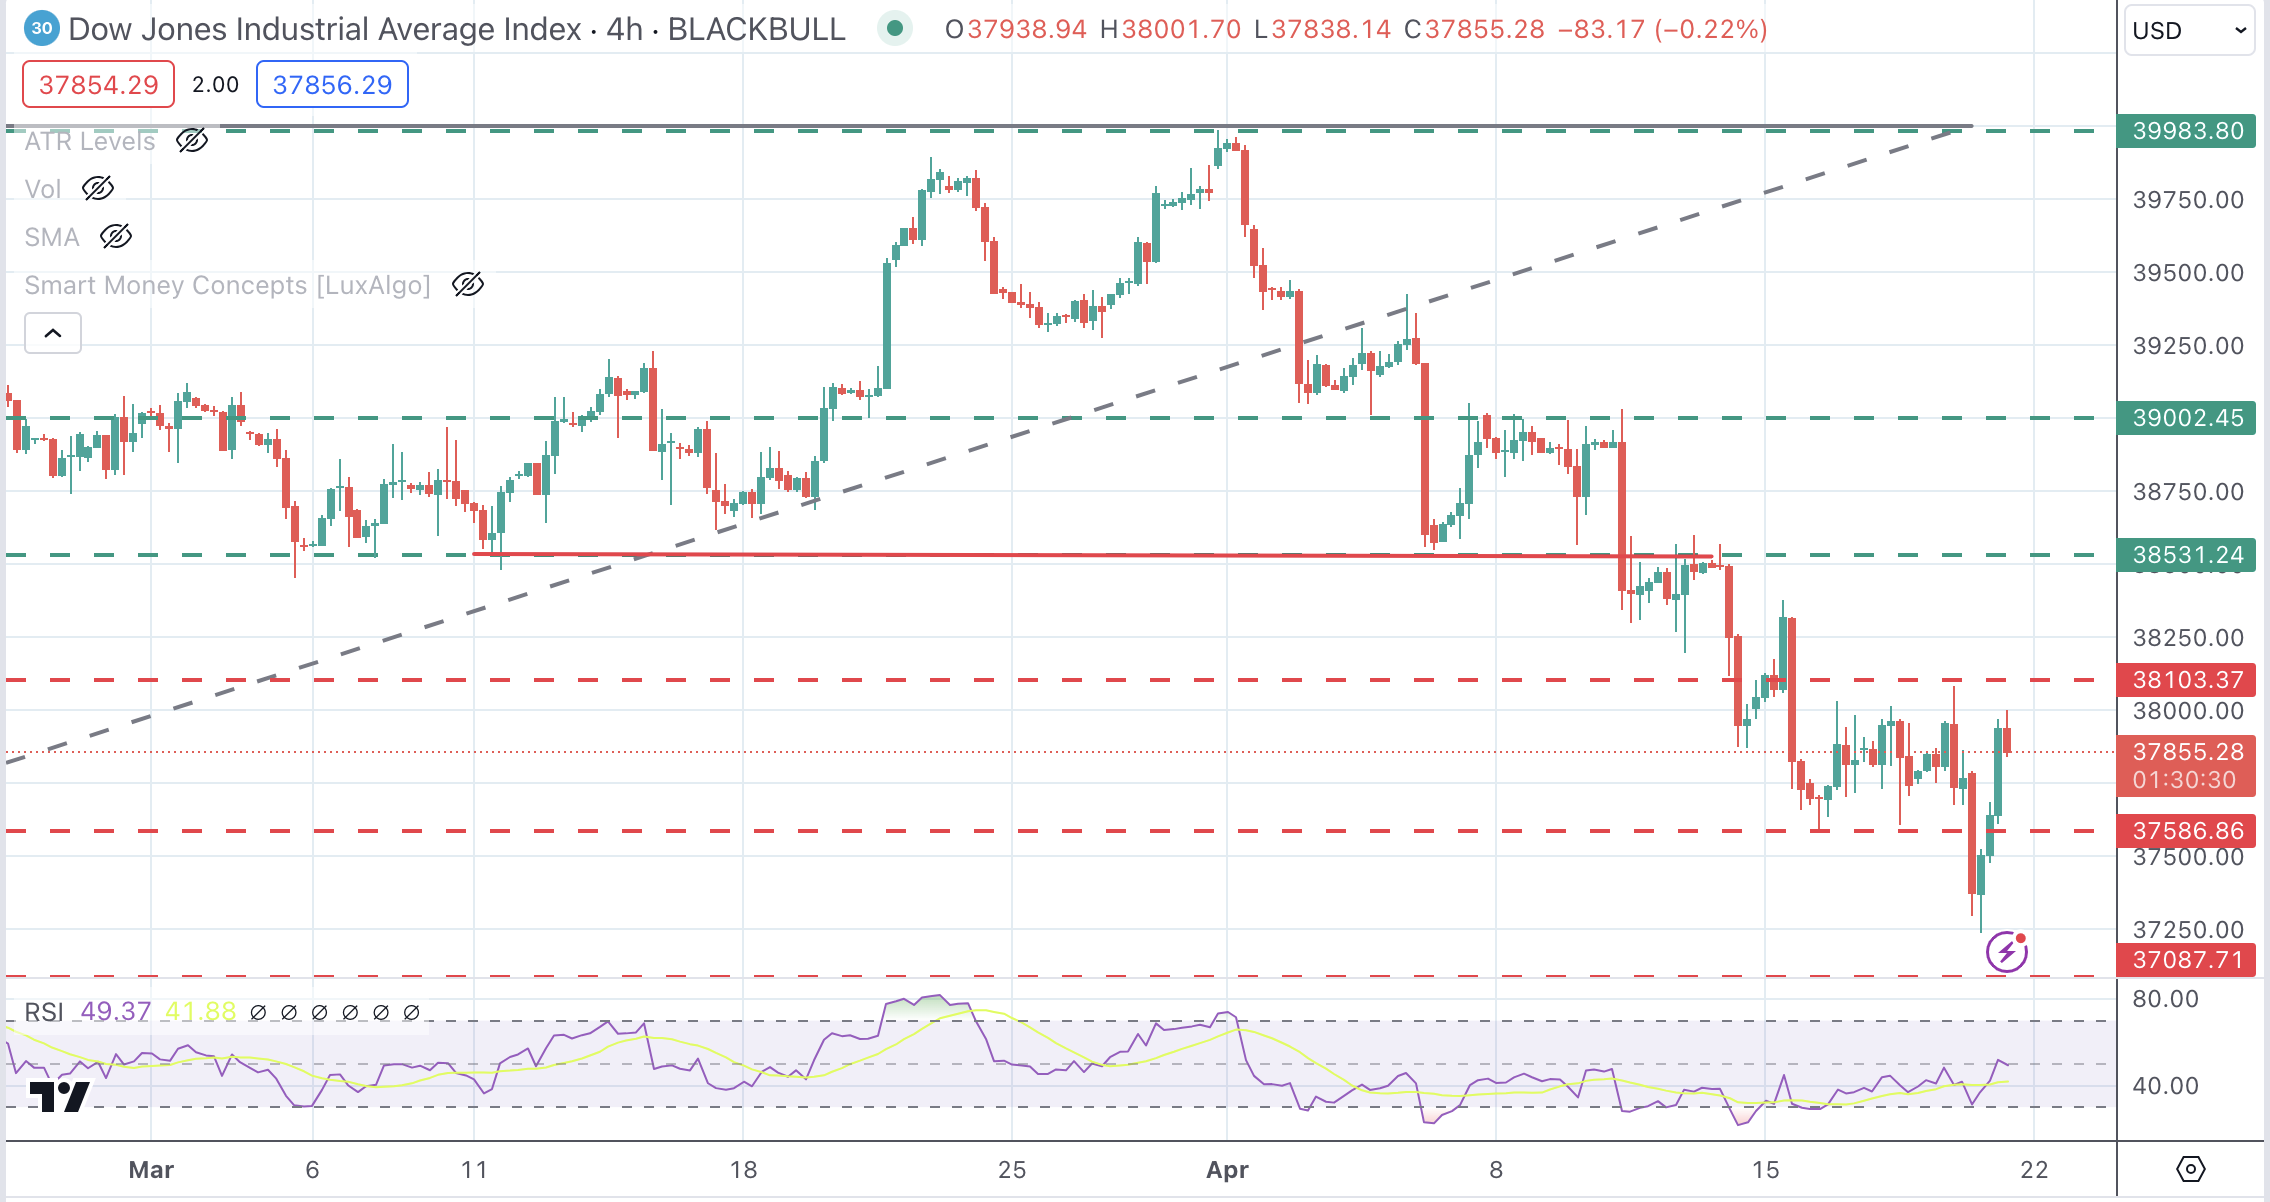
Dow Jones technical outlook
The DJIA is trimming some losses on Friday, although the broader bearish trend from March highs near 40,000 remains intact. The resistance area at 38,103 should be breached to ease downside pressure and clear the path toward 38,530.
On the downside, the support level at 37,087 is the 38.2% Fibonacci retracement of the November-March rally and a previous support area. This might be a tough nut to crack for sellers. Below here, the target is 36,545.
Dow Jones Index 4-Hour Chart
Nasdaq FAQs
The Nasdaq is a stock exchange based in the US that started out life as an electronic stock quotation machine. At first, the Nasdaq only provided quotations for over-the-counter (OTC) stocks but later it became an exchange too. By 1991, the Nasdaq had grown to account for 46% of the entire US securities’ market. In 1998, it became the first stock exchange in the US to provide online trading. The Nasdaq also produces several indices, the most comprehensive of which is the Nasdaq Composite representing all 2,500-plus stocks on the Nasdaq, and the Nasdaq 100.
The Nasdaq 100 is a large-cap index made up of 100 non-financial companies from the Nasdaq stock exchange. Although it only includes a fraction of the thousands of stocks in the Nasdaq, it accounts for over 90% of the movement. The influence of each company on the index is market-cap weighted. The Nasdaq 100 includes companies with a significant focus on technology although it also encompasses companies from other industries and from outside the US. The average annual return of the Nasdaq 100 has been 17.23% since 1986.
There are a number of ways to trade the Nasdaq 100. Most retail brokers and spread betting platforms offer bets using Contracts for Difference (CFD). For longer-term investors, Exchange-Traded Funds (ETFs) trade like shares that mimic the movement of the index without the investor needing to buy all 100 constituent companies. An example ETF is the Invesco QQQ Trust (QQQ). Nasdaq 100 futures contracts allow traders to speculate on the future direction of the index. Options provide the right, but not the obligation, to buy or sell the Nasdaq 100 at a specific price (strike price) in the future.
Many different factors drive the Nasdaq 100 but mainly it is the aggregate performance of the component companies revealed in their quarterly and annual company earnings reports. US and global macroeconomic data also contributes as it impacts on investor sentiment, which if positive drives gains. The level of interest rates, set by the Federal Reserve (Fed), also influences the Nasdaq 100 as it affects the cost of credit, on which many corporations are heavily reliant. As such the level of inflation can be a major driver too as well as other metrics which impact on the decisions of the Fed.
Recommended Articles


