

Dow Jones Industrial Average dips further following bank earnings data
- Dow Jones index drops for fourth session this week, on track to post nearly 4.5% reversal from late March highs near 40,000.
- JPMorgan leads losses as quarterly earnings failed to meet expectations.
- News that China has told tech firms to phase out foreign chips hammers chipmakers.
The Dow Jones Industrial Average (DJIA) is reversing Thursday’s gains on a negative session opening on Friday. The quarterly earnings of some of the largest US banks have failed to cheer investors, who are already feeling frail sentiment on lower hopes of monetary easing by the Federal Reserve (Fed).
JPMorgan (JPM) and Wells Fargo (WFC) have posted softer-than-expected results in the first quarter, which is weighing on the financial sector. Beyond that, mega-caps and chipmakers are suffering on the back of news reporting that China has told telecom firms to phase out foreign chips.
The NASDAQ is leading losses on Friday, down 1.1% to 16,258, the S&P 500 drops 0.96% to 5,149, and the Dow Jones trades with a 0.8% loss at 38,148 halfway through the North American morning session.
Dow Jones news
All the Wall Street sectors are posting losses on Friday. The Technology sector posts a 1.23% decline, the weakest performance, followed by the Consumer Discretionary, 1.25% lower. The Energy and Utilities sectors, practically flat, are the best-performing ones.
JPMorgan is taking the biggest blow on Friday with a 5.34% decline to $184.96 following disappointing quarterly data, while Intel (INTC), which has been crushed by news about China’s decision, is 3.8% lower to $36.19.
On the positive side, Nike (NKE) advances 0.53% to $92.51 after Bank of America (BAC) upgraded its price target. Next is Apple (AAPL), up 0.51% to $175.95.
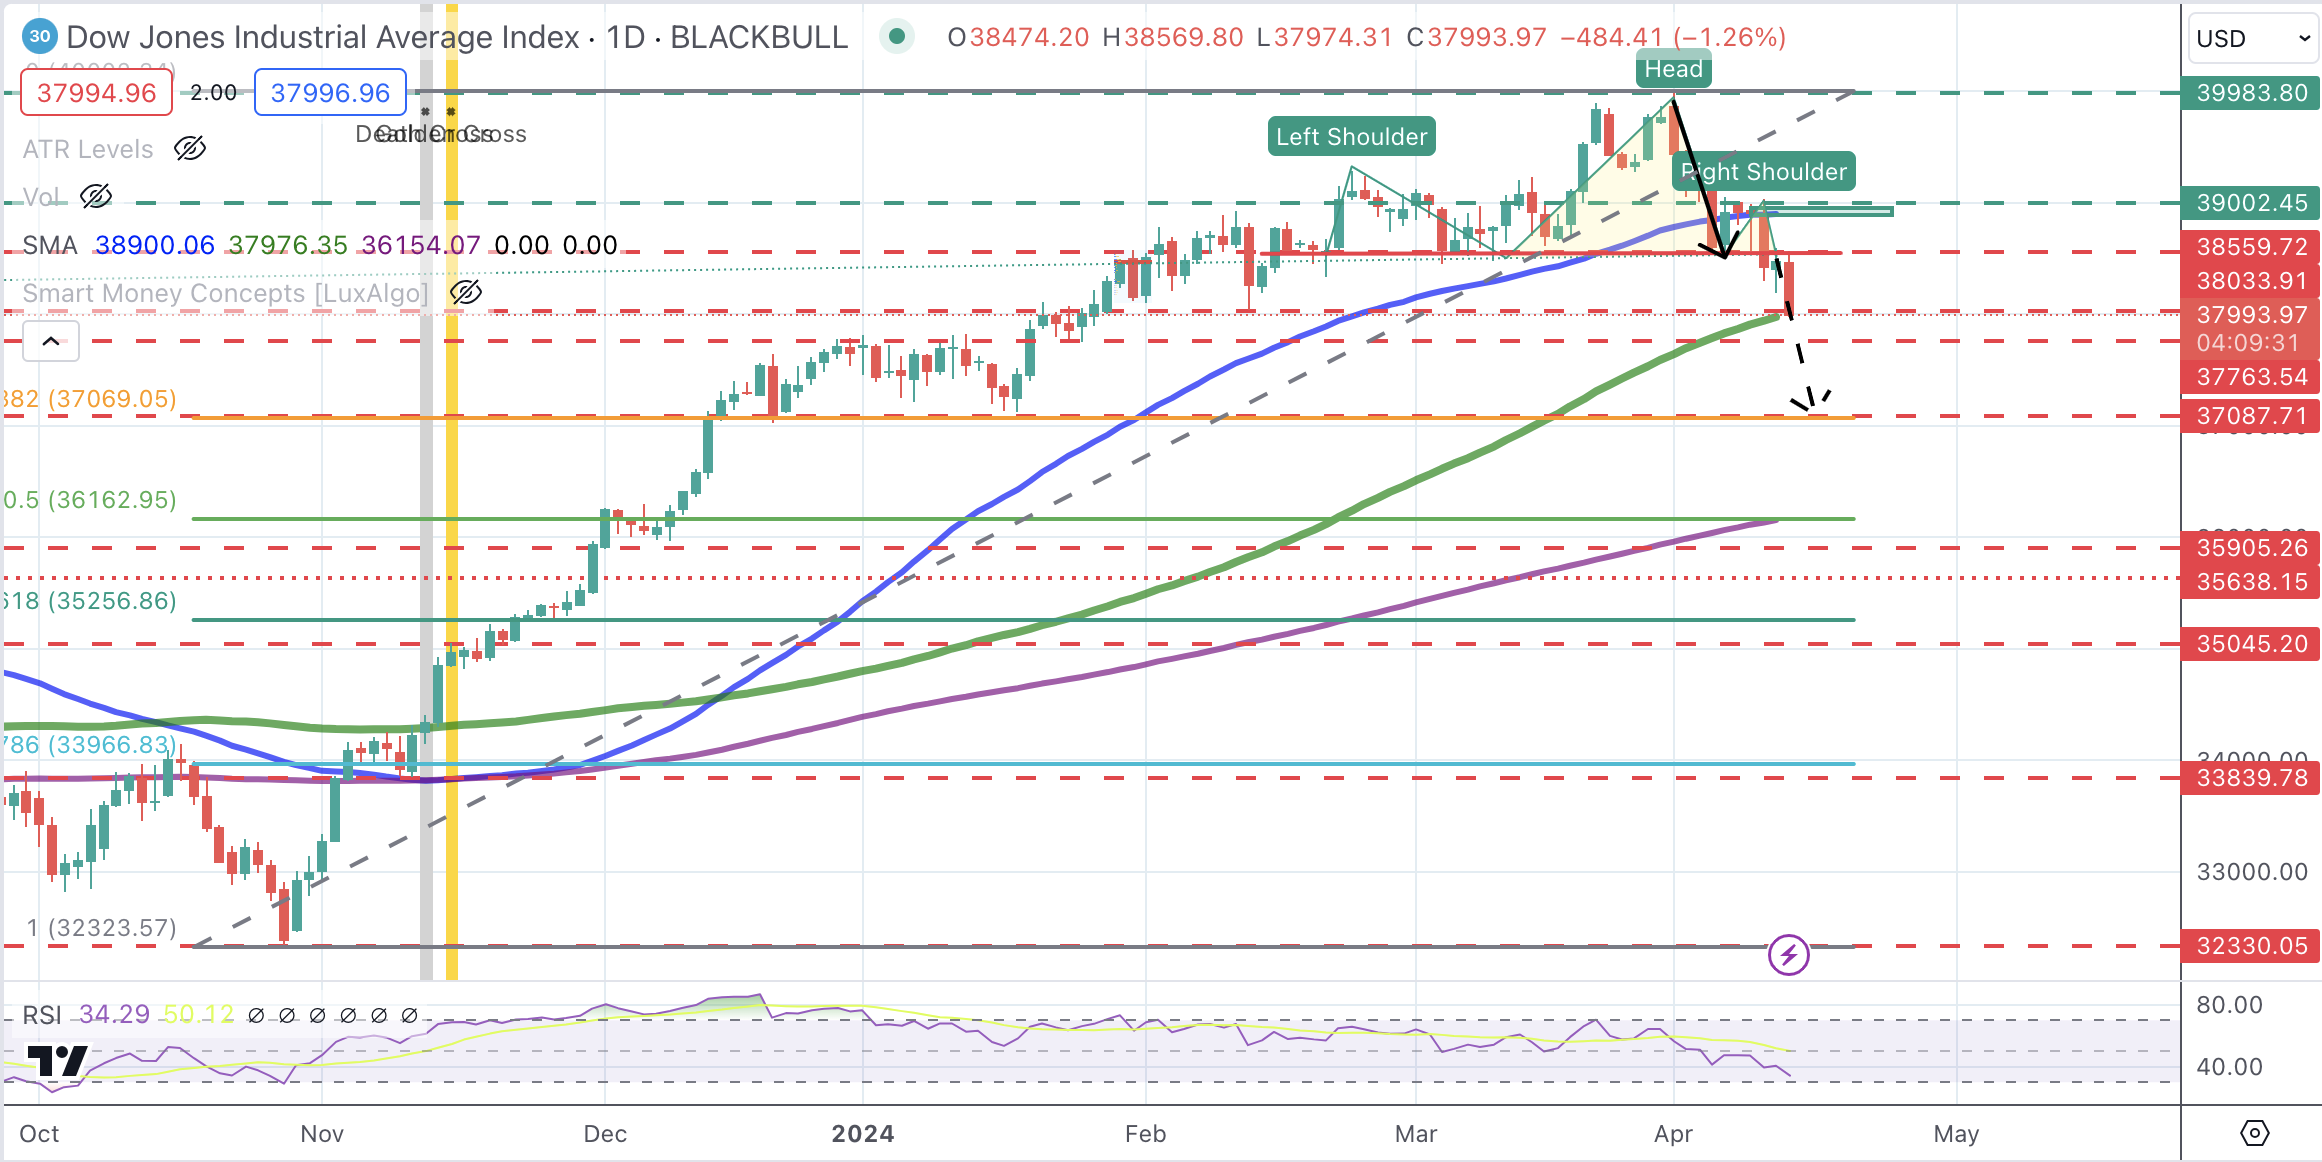
Dow Jones technical outlook
The Dow Jones index keeps drifting away from the historic highs reached in March. The move below 38,560 has activated a bearish Head & Shoulders pattern that might anticipate a sharper decline.
The next bearish targets are 38,000 and 37,750. The measured target of the H&S pattern is the mid-January low and 38.6% Fibonacci retracement at 37,087. A bullish reaction above 38,540 might find some more supply ahead of 39,000 (order block).
Dow Jones Index Daily Chart
Nasdaq FAQs
The Nasdaq is a stock exchange based in the US that started out life as an electronic stock quotation machine. At first, the Nasdaq only provided quotations for over-the-counter (OTC) stocks but later it became an exchange too. By 1991, the Nasdaq had grown to account for 46% of the entire US securities’ market. In 1998, it became the first stock exchange in the US to provide online trading. The Nasdaq also produces several indices, the most comprehensive of which is the Nasdaq Composite representing all 2,500-plus stocks on the Nasdaq, and the Nasdaq 100.
The Nasdaq 100 is a large-cap index made up of 100 non-financial companies from the Nasdaq stock exchange. Although it only includes a fraction of the thousands of stocks in the Nasdaq, it accounts for over 90% of the movement. The influence of each company on the index is market-cap weighted. The Nasdaq 100 includes companies with a significant focus on technology although it also encompasses companies from other industries and from outside the US. The average annual return of the Nasdaq 100 has been 17.23% since 1986.
There are a number of ways to trade the Nasdaq 100. Most retail brokers and spread betting platforms offer bets using Contracts for Difference (CFD). For longer-term investors, Exchange-Traded Funds (ETFs) trade like shares that mimic the movement of the index without the investor needing to buy all 100 constituent companies. An example ETF is the Invesco QQQ Trust (QQQ). Nasdaq 100 futures contracts allow traders to speculate on the future direction of the index. Options provide the right, but not the obligation, to buy or sell the Nasdaq 100 at a specific price (strike price) in the future.
Many different factors drive the Nasdaq 100 but mainly it is the aggregate performance of the component companies revealed in their quarterly and annual company earnings reports. US and global macroeconomic data also contributes as it impacts on investor sentiment, which if positive drives gains. The level of interest rates, set by the Federal Reserve (Fed), also influences the Nasdaq 100 as it affects the cost of credit, on which many corporations are heavily reliant. As such the level of inflation can be a major driver too as well as other metrics which impact on the decisions of the Fed.
Recommended Articles


