

Dow Jones Industrial Average tumbles, crushed by strong US inflation
- Wall Street indexes plunge as US inflation dampens hopes of Fed rate cuts in June.
- All sectors are trading lower with Real Estate and Utilities the most affected.
- The Dow Jones Index is under increasing bearish pressure below 38,540 with scope to retest 38,035 area.
Equity markets are taking a blow on Wednesday as an unexpectedly strong US inflation report has hammered hopes that the Federal Reserve (Fed) may start lowering borrowing costs in the near term.
US Consumer Prices Index (CPI) accelerated at a 0.4% pace in March, against expectations of a slowdown to 0.3%, while the yearly rate increased to 3.5% from 3.2% in the previous month. These numbers confirm that price pressures remain stubbornly high and ditch the market’s roadmap of three rate cuts in 2024, starting in June.
The risk-averse reaction to CPI data has sent the main US indices tumbling. The Dow Jones leads losses, down 1.27% to 38,383, increasing its distance from March highs near 40,000. The S&P 500 and the NASDAQ index drop 1.13% each to 5,150 and 16,117, respectively.
Dow Jones news
All Wall Street sectors are posting losses on Wednesday. Real Estate is the most affected by higher-for-longer interest rates and falls 4.24%, followed by Utilities, down 2.05%, and Materials, which gives away 1.6%. The least- affected sectors are Energy, only 0.5% lower, and Communication Services with a 0.65% decline.
Home Depot (HD) is leading losses with a 2.88% drop to $351.05, followed by Boeing (BA), 2.75% lower to $173.29, and Intel (INTL), which is losing 2.65% to $38.31. Only Walmart (WMT) is in the green on Wednesday with a 0.7% advance to $60.20.
Dow Jones technical outlook
The Dow Jones index is on track to print a strong bearish candle on the daily chart, confirming the negative trend from the March top, right below 40,000.
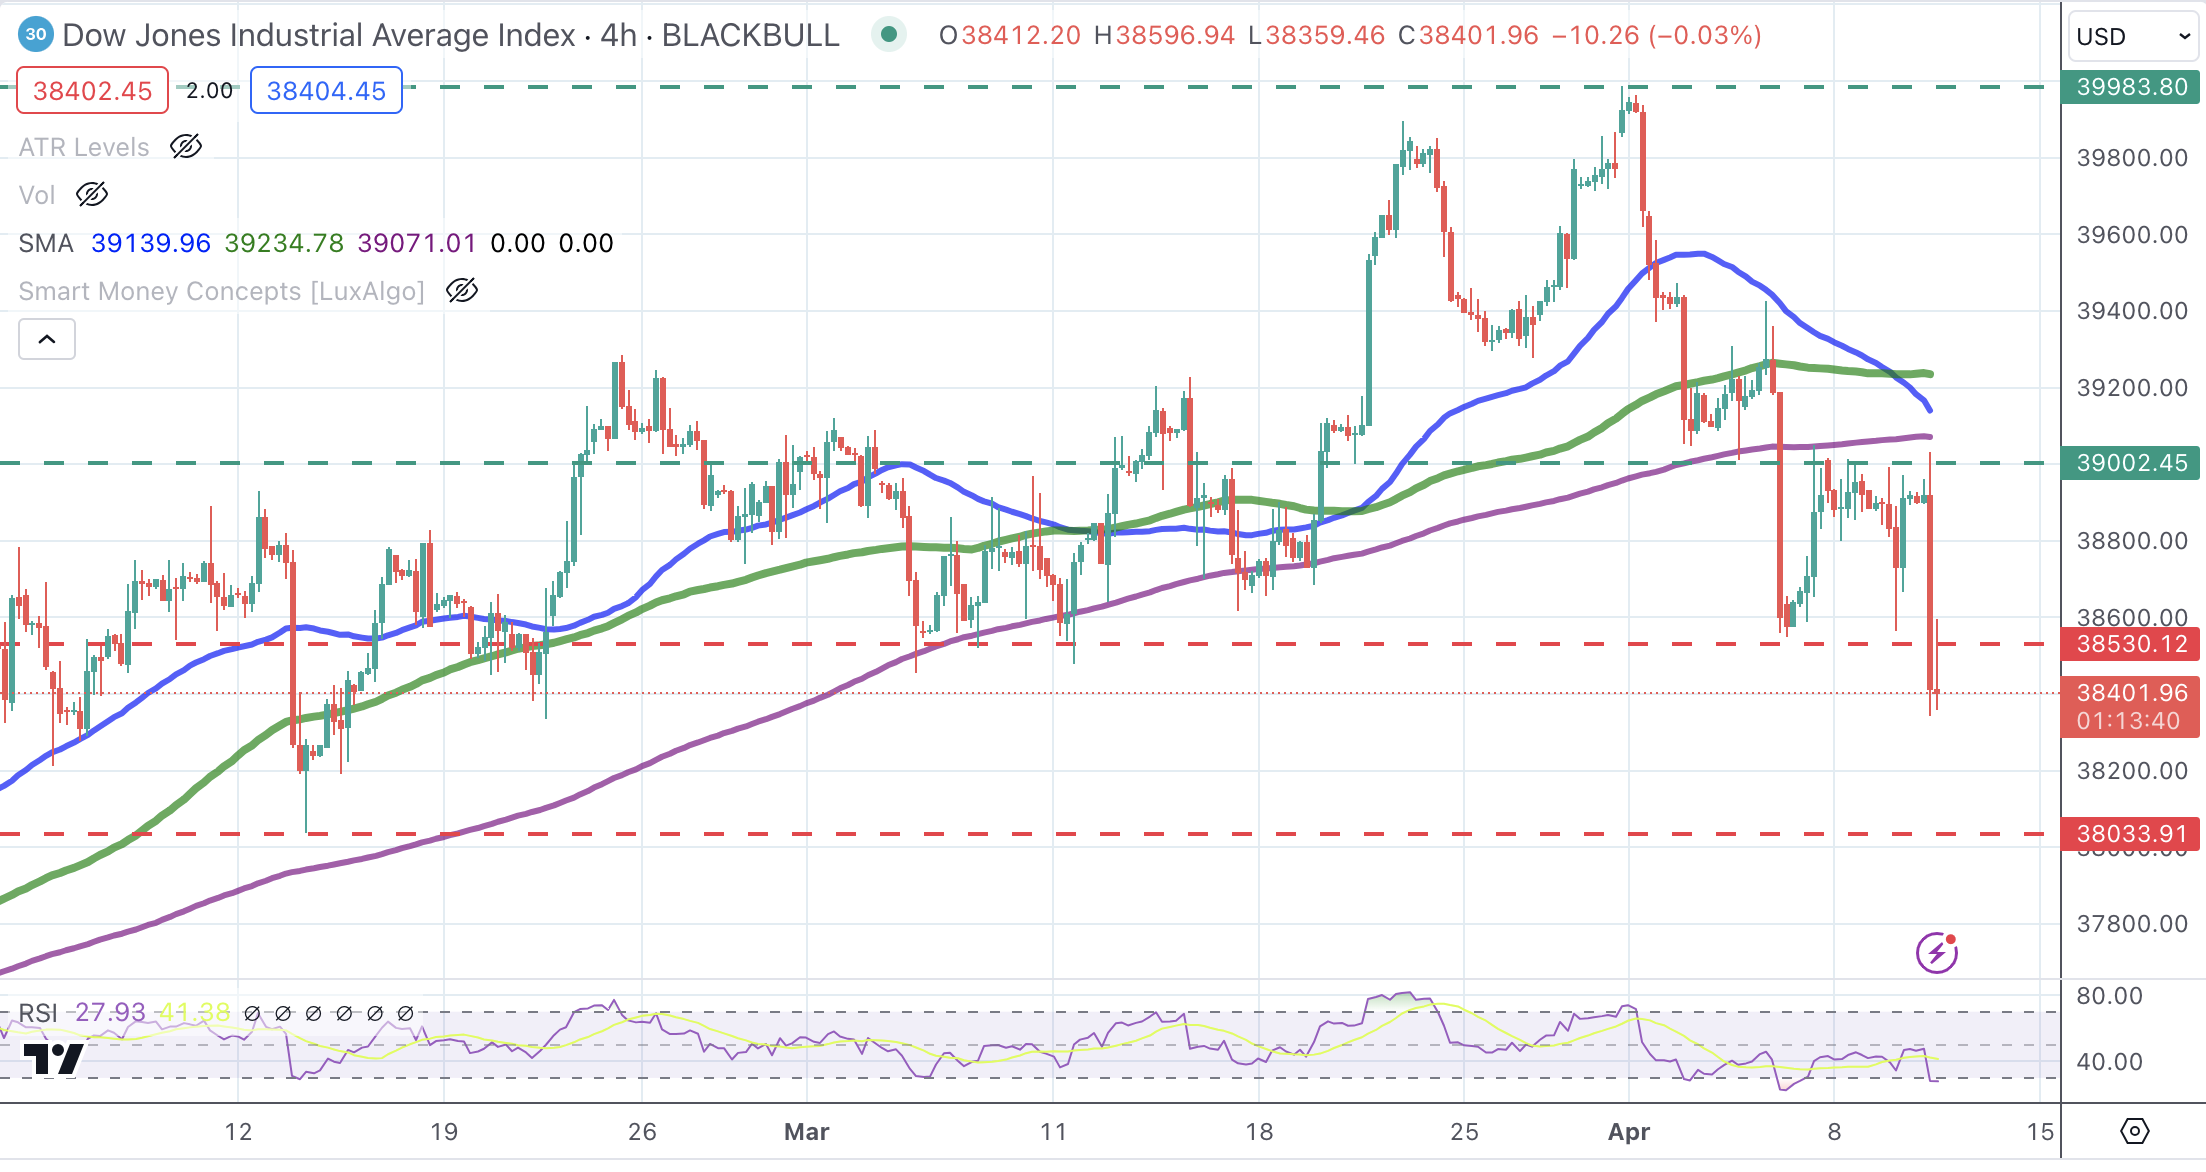
The strong reaction to the US inflation data has pushed the Index below the 38,540 support level, with the bearish cross between the 4-hour 50 and 100 Simple Moving Averages (SMAs) giving hope to bears. Below here, the next target is 38,033.
The previous support at the mentioned 38,540 is likely to offer some resistance, and above there, an order block, right below 39,000, will challenge a potential bullish attempt.
Dow Jones Index 4-Hour Chart
Risk sentiment FAQs
In the world of financial jargon the two widely used terms “risk-on” and “risk off'' refer to the level of risk that investors are willing to stomach during the period referenced. In a “risk-on” market, investors are optimistic about the future and more willing to buy risky assets. In a “risk-off” market investors start to ‘play it safe’ because they are worried about the future, and therefore buy less risky assets that are more certain of bringing a return, even if it is relatively modest.
Typically, during periods of “risk-on”, stock markets will rise, most commodities – except Gold – will also gain in value, since they benefit from a positive growth outlook. The currencies of nations that are heavy commodity exporters strengthen because of increased demand, and Cryptocurrencies rise. In a “risk-off” market, Bonds go up – especially major government Bonds – Gold shines, and safe-haven currencies such as the Japanese Yen, Swiss Franc and US Dollar all benefit.
The Australian Dollar (AUD), the Canadian Dollar (CAD), the New Zealand Dollar (NZD) and minor FX like the Ruble (RUB) and the South African Rand (ZAR), all tend to rise in markets that are “risk-on”. This is because the economies of these currencies are heavily reliant on commodity exports for growth, and commodities tend to rise in price during risk-on periods. This is because investors foresee greater demand for raw materials in the future due to heightened economic activity.
The major currencies that tend to rise during periods of “risk-off” are the US Dollar (USD), the Japanese Yen (JPY) and the Swiss Franc (CHF). The US Dollar, because it is the world’s reserve currency, and because in times of crisis investors buy US government debt, which is seen as safe because the largest economy in the world is unlikely to default. The Yen, from increased demand for Japanese government bonds, because a high proportion are held by domestic investors who are unlikely to dump them – even in a crisis. The Swiss Franc, because strict Swiss banking laws offer investors enhanced capital protection.
Recommended Articles


