US Dollar Index Price Analysis: Range bound price waits for directional clarity

Source Fxstreet
  • A long-term technical analysis of the Dollar Index suggests a sideways trend. 
  • This is likely to continue until a decisive break above or below the range. 
  • The index is currently meeting resistance from the 100-week Simple Moving Average. 

The US Dollar Index (DXY), which measures the strength of the US Dollar (USD) against a basket of trade-weighted competitors, is in a long-term sideways trend which has lasted for between six months and a year. 
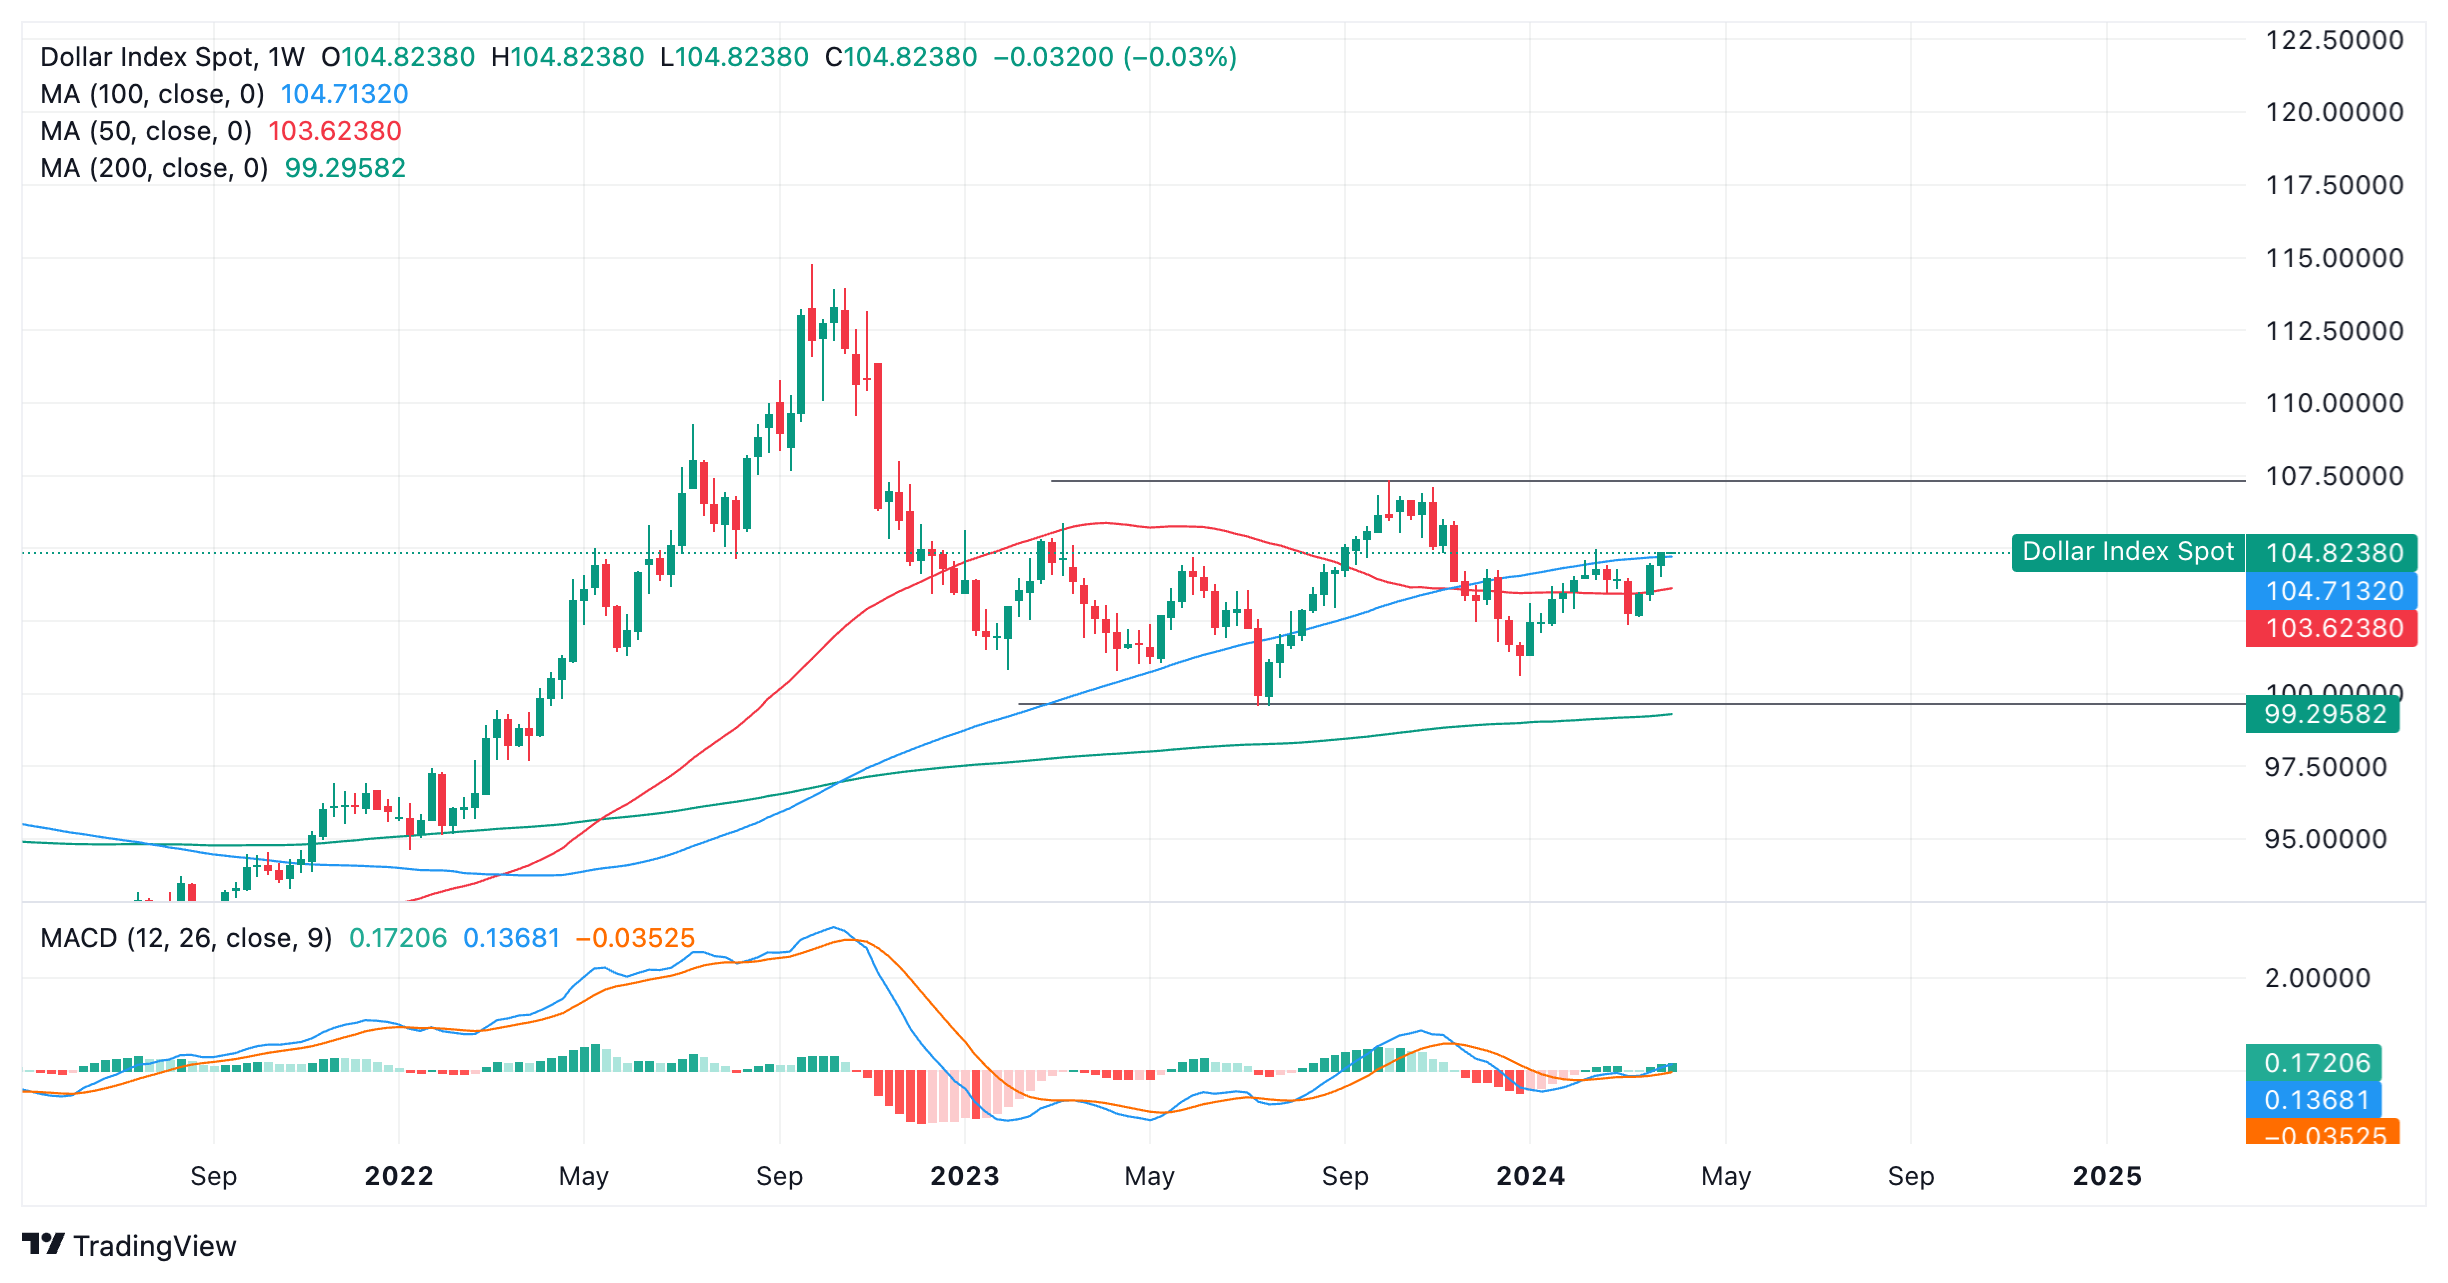
US Dollar Index: Weekly chart

Within its range-locked consolidation, it is currently meeting resistance after rising up to the 100-week Simple Moving Average (SMA) at 104.71. 

There is a possibility it could retreat from this substantial barrier. The 50-week SMA sits not far below at around 103.62 and could provide support. 

Prior to the formation of the range the Dollar index’s outlook was more bearish. The index reversed sharply at the September 2022 highs and tumbled. The sharpness and depth of the decline suggested the possibility of a major reversal in the trend, however, DXY found support first at 100.00 and then in the 99.00s before reversing and making a recovery. 

Since the index found a floor in 2023 it has been oscillating between the aforementioned lows and a top at roughly 107.00.

It would require a decisive break below 99.56 – the July 2023 lows – to indicate bears were back in the driving seat. Such a move would change the trend to bearish and suggest even lower lows were on the horizon. 

Alternatively, a decisive break back above 107.00 would tone the chart more bullishly, and suggest a climb back up to the 114.78 high of 2022.  

"Decisive" would mean a weekly candle that broke and closed well away from the range high or low, or three consecutive bearish/bullish weeks that ended well away from the range high or low. 

Until either materializes, price is seen continuing its sideways trending pattern.


Disclaimer: For information purposes only. Past performance is not indicative of future results.
placeholder
Gold Price Forecast: XAU/USD declines below $4,050 on USD strength and hawkish Fed comments Gold price (XAU/USD) extends the decline to around $4,030 during the early Asian session on Tuesday. The precious metal edges lower as traders dialed back expectations of a US interest rate cut next month.
Author  FXStreet
Nov 18, Tue
Gold price (XAU/USD) extends the decline to around $4,030 during the early Asian session on Tuesday. The precious metal edges lower as traders dialed back expectations of a US interest rate cut next month.
placeholder
Top 3 Price Prediction: Bitcoin, Ethereum, Ripple – BTC, ETH and XRP Look for a Foothold After a Sharp ShakeoutBitcoin trades near $92,600 after a dip below $90,000, while Ethereum around $3,118 and XRP near $2.21–$2.23 sit on key support zones, as BTC, ETH and XRP all try to turn a sharp correction into a tradable rebound rather than a deeper slide.
Author  Mitrade
Nov 19, Wed
Bitcoin trades near $92,600 after a dip below $90,000, while Ethereum around $3,118 and XRP near $2.21–$2.23 sit on key support zones, as BTC, ETH and XRP all try to turn a sharp correction into a tradable rebound rather than a deeper slide.
placeholder
Could XRP Really Catch Ethereum? Analysts Revisit the Question as ETF Tailwinds BuildAs US spot XRP ETFs roll out and issuers like Canary Capital and Franklin Templeton step in, analysts say XRP’s market cap could climb on growing utility and ETF accumulation—but overtaking Ethereum’s $373 billion smart-contract powerhouse remains a long-shot, at least for now.
Author  Mitrade
Nov 20, Thu
As US spot XRP ETFs roll out and issuers like Canary Capital and Franklin Templeton step in, analysts say XRP’s market cap could climb on growing utility and ETF accumulation—but overtaking Ethereum’s $373 billion smart-contract powerhouse remains a long-shot, at least for now.
placeholder
Bitcoin's Drop to $86K Approaches 'Max Pain' Zone, Yet Presents Potential Buying OpportunityAnalysts identify the $84,000 to $73,000 range as Bitcoin's likely "max pain" territory where capitulation may occur.
Author  Mitrade
Nov 21, Fri
Analysts identify the $84,000 to $73,000 range as Bitcoin's likely "max pain" territory where capitulation may occur.
placeholder
Market Meltdown: BTC, ETH, and XRP Capitulate as Bears Seize ControlBitcoin trades around $85,900 after breaking below $86,000, with Ethereum under $2,791 and XRP below $1.99 as BTC, ETH and XRP extend weekly losses of 8–10%, forcing traders to focus on supports at $85,000, $2,749 and $1.77 for clues on whether this sell-off has further to run.
Author  Mitrade
Nov 21, Fri
Bitcoin trades around $85,900 after breaking below $86,000, with Ethereum under $2,791 and XRP below $1.99 as BTC, ETH and XRP extend weekly losses of 8–10%, forcing traders to focus on supports at $85,000, $2,749 and $1.77 for clues on whether this sell-off has further to run.
goTop
quote