


Dow Jones Industrial Average posts moderate advance on thin trading
- Dow Jones is leading gains in pre-holiday session on Wednesday.
- Wall Street Indexes are mixed after a positive opening amid frail market sentiment.
- Investors are looking from the sidelines ahead of Friday’s PCE Prices Index data.
The Dow Jones Industrial Average (DJIA) is leading the major US stock indexes higher early in a calm trading session on Wednesday with some Fed speakers and US PCE Prices Index data in focus.
The Dow Jones Index is trading nearly 0.5% higher at 39,465 but still at a significant distance from the 39,900 historic high reached last week. The S&P 500 Index is 0.24% up, while the NASDAQ-100 Tech Index is trading with marginal losses following a positive opening.
Dow Jones news
Most of the sectors belonging to the Dow Jones index are posting gains on Wednesday, with Utilities and Real State outperforming with 1.91% and 1.61% respective advances. On the negative side, only the Technology sector and
Communication Services are in the red, down 0.5% each and giving away Tuesday’s gains.
The pharmaceutical company Merck & Co (MRK) is leading gains on Wednesday with a 3.96% rally, trading at $130.43, followed by Intel (INTC) with a 2.48% increase to $43.03. Among the few losers, Salesforce (CRM) is 2.22% lower on the day, trading at $299.03 and Visa (V) dropping 0.9% to $278.13.
The calendar is thin this week with only a Wednesday conference by Federal Reserve (Fed) Governor Christopher Waller worth mentioning. The highlight of the week is Friday’s Personal Consumption Prices Index, Which is expected to provide fresh cues into the bank’s monetary policy plans and Fed Chair Powell’s speech shortly afterward.
Dow Jones technical outlook
From a technical perspective, the broader bias for the Dow Jones Index remains bullish, with hopes of lower borrowing costs keeping bears at bay.
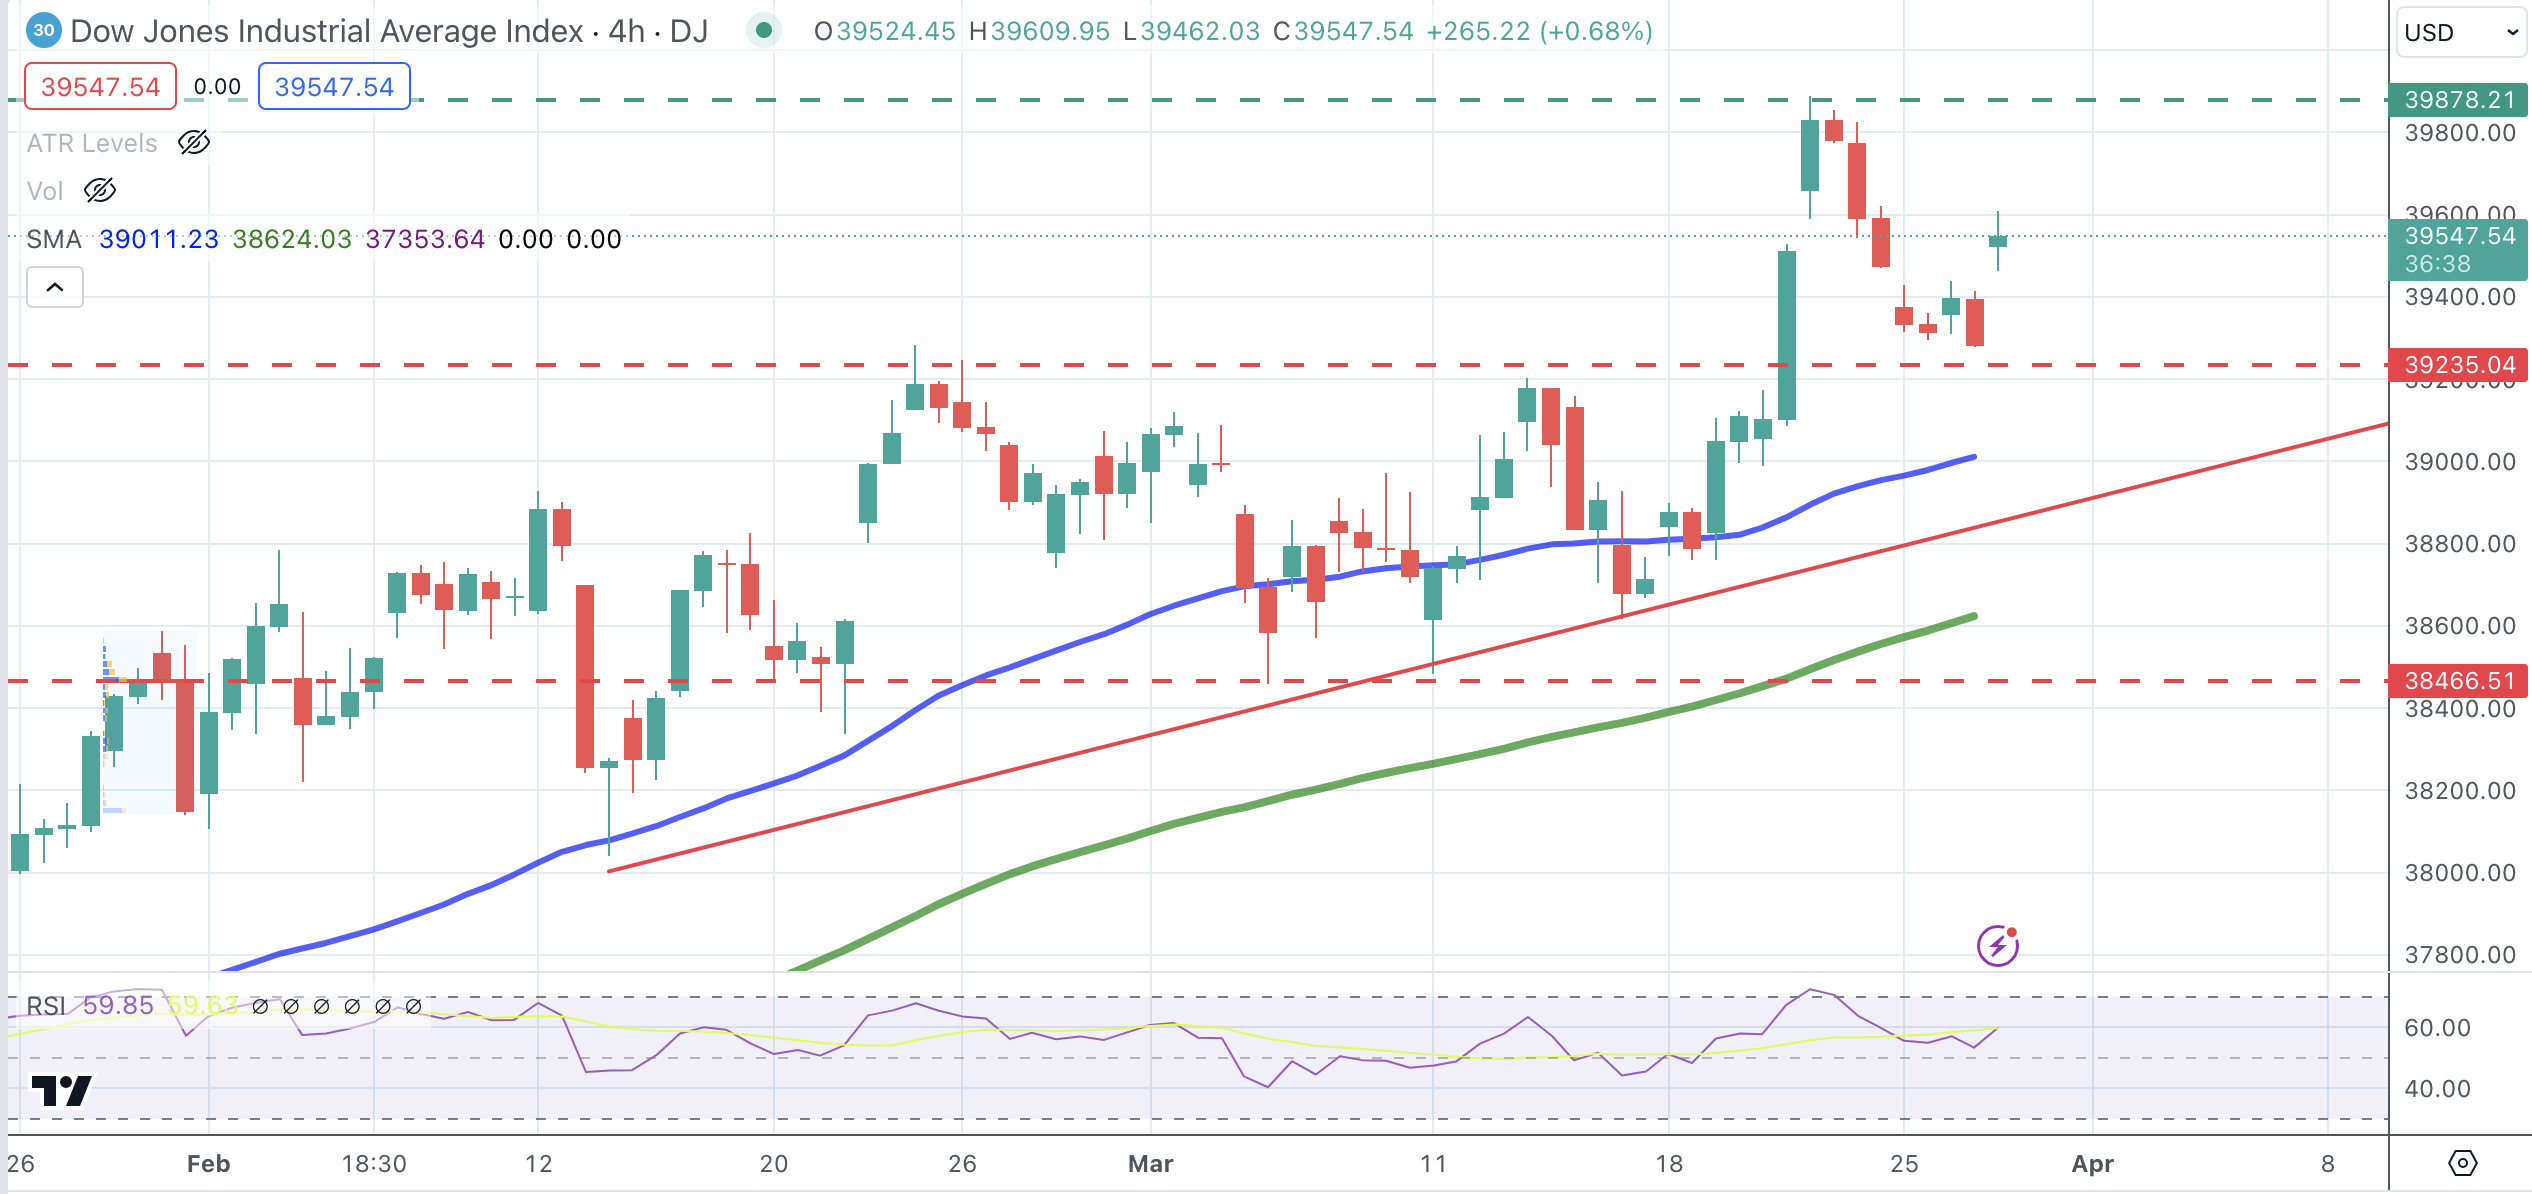
The previous resistance area, now turned into support, and the 4-hour 50 Simple Moving Average (SMA) converging at 39,250 are limiting downside attempts for now. Below here, the next downside targets lie at the 39,000 level and the trendline support at 38,775.
On the upside, resistances at the 39,900 previous high and the 40,000 psychological level are likely to offer significant pushback for bulls.
Dow Jones Index 4-Hour Chart
Dow Jones FAQs
The Dow Jones Industrial Average, one of the oldest stock market indices in the world, is compiled of the 30 most traded stocks in the US. The index is price-weighted rather than weighted by capitalization. It is calculated by summing the prices of the constituent stocks and dividing them by a factor, currently 0.152. The index was founded by Charles Dow, who also founded the Wall Street Journal. In later years it has been criticized for not being broadly representative enough because it only tracks 30 conglomerates, unlike broader indices such as the S&P 500.
Many different factors drive the Dow Jones Industrial Average (DJIA). The aggregate performance of the component companies revealed in quarterly company earnings reports is the main one. US and global macroeconomic data also contributes as it impacts on investor sentiment. The level of interest rates, set by the Federal Reserve (Fed), also influences the DJIA as it affects the cost of credit, on which many corporations are heavily reliant. Therefore, inflation can be a major driver as well as other metrics which impact the Fed decisions.
Dow Theory is a method for identifying the primary trend of the stock market developed by Charles Dow. A key step is to compare the direction of the Dow Jones Industrial Average (DJIA) and the Dow Jones Transportation Average (DJTA) and only follow trends where both are moving in the same direction. Volume is a confirmatory criteria. The theory uses elements of peak and trough analysis. Dow’s theory posits three trend phases: accumulation, when smart money starts buying or selling; public participation, when the wider public joins in; and distribution, when the smart money exits.
There are a number of ways to trade the DJIA. One is to use ETFs which allow investors to trade the DJIA as a single security, rather than having to buy shares in all 30 constituent companies. A leading example is the SPDR Dow Jones Industrial Average ETF (DIA). DJIA futures contracts enable traders to speculate on the future value of the index and Options provide the right, but not the obligation, to buy or sell the index at a predetermined price in the future. Mutual funds enable investors to buy a share of a diversified portfolio of DJIA stocks thus providing exposure to the overall index.
Recommended Articles


