
Crypto Today: Bitcoin, Ethereum, XRP steady as traders brace for key US macro events
- Bitcoin broadly consolidates as traders' focus shifts to US economic data and the Federal Reserve decision.
- Ethereum moves sideways around the $3,800 level, backed by steady institutional demand for spot ETFs.
- XRP downside risks persist as the MACD continues to show a sell signal and the RSI declines toward neutral levels.
Cryptocurrency prices are generally steady on Wednesday, front-lined by Bitcoin (BTC) price's stability in the range of $116,000 to $120,000. Ethereum (ETH) has managed to keep bears at bay and is moving sideways around the $3,800 level, underpinned by steady institutional demand for spot Exchange-Traded Funds (ETFs).
As for Ripple (XRP), recovery toward its record high of $3.66 has been elusive since the drop to $2.95 on Thursday, trading at $3.10 at the time of writing.
The next few days will be crucial for the broader cryptocurrency market, as investors shift focus to United States (US) economic data and macro events, including the Federal Reserve (Fed) decision on interest rates.
Market overview: Bitcoin faces indecision ahead of the Fed rate decision
The Federal Reserve Open Market Committee (FOMC) is expected to leave interest rates steady in the range of 4.25% to 4.50%, following the meeting on Wednesday. However, Fed Chair Jerome Powell's remarks could provide insight into the central bank's monetary policy direction.
According to CNBC, this meeting is of more importance to market participants, not because of the rate decision, but the central bank's overall outlook on the economy, in line with the perceived impact of US President Donald Trump's tariffs.
Still, Wednesday's meeting is the first since President Trump's historic visit to the Fed's construction site, and by extension, his continued criticism of Powell.
The Fed interest rate decision and the officials' remarks backing it could guide risk sentiment, especially in the cryptocurrency market. Institutional demand for Bitcoin spot ETFs has tapered off, with low volumes recorded last week. Hence, the policy outlook could help investors gauge risk sentiment ahead of the next Fed decision in September.
Data spotlight: Institutional demand backs Ethereum's stability
Risk appetite for Ethereum investment products has remained steady in July, backed by increased demand from both institutional and retail investors. Capital inflow into Ethereum-related financial products flipped Bitcoin last week, averaging $1.59 billion. In contrast, Bitcoin investment products recorded a net outflow volume of $175 million last week, according to a CoinShares report.
Meanwhile, US ETH spot ETFs attracted a net inflow of around $219 million on Tuesday, continuing the unbroken bullish streak since July 2. The cumulative total inflow currently stands at $9.62 billion, with net assets averaging around $21.61 billion.

Ethereum spot ETF data | Source: SoSoValue
The demand for US BTC spot ETFs has significantly reduced over the last week, compared to mid-July when Bitcoin price rallied, reaching a new record high of $123,218. Despite the decline in volume, there have been four consecutive days of inflows, with approximately $80 million recorded on Tuesday. The cumulative total net inflow stands at $55 billion, with net assets averaging around $153 billion.
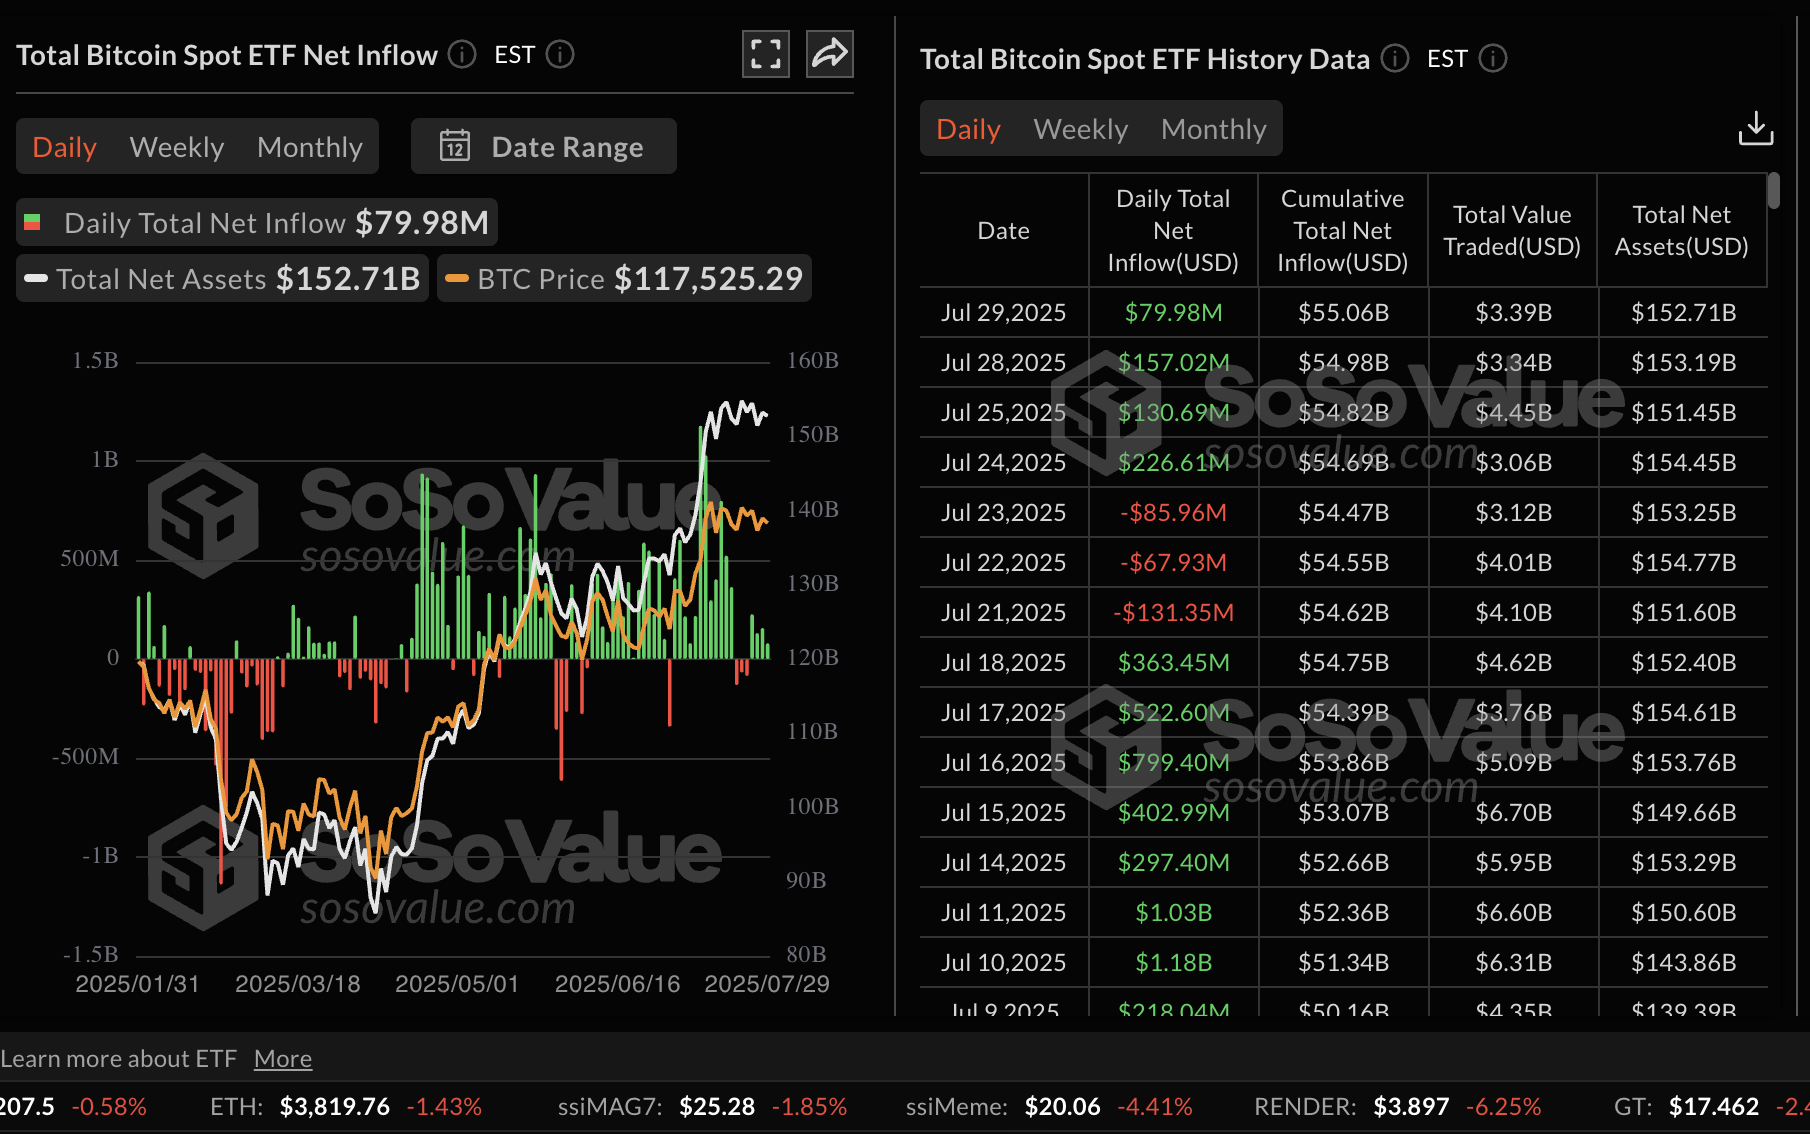
Bitcoin spot ETF data | Source: SoSoValue
Chart of the day: Bitcoin extends consolidation
Bitcoin price is broadly consolidating above support around $116,000 and resistance at $120,000. Its technical outlook leans slightly bearish, with the Moving Average Convergence Divergence (MACD) indicator maintaining a sell signal on the daily chart below since Thursday.
If macroeconomic uncertainty creates instability, traders could consider reducing exposure, which will contribute to the selling pressure. Hence, another sweep for liquidity in lower support zones such as $116,000 and the 50-day Exponential Moving Average (EMA) currently at $112,736 cannot be shrugged off immediately.
The downward-trending Relative Strength Index (RSI) at 58 affirms the short-term bearish outlook, signifying the reduction in buying pressure.
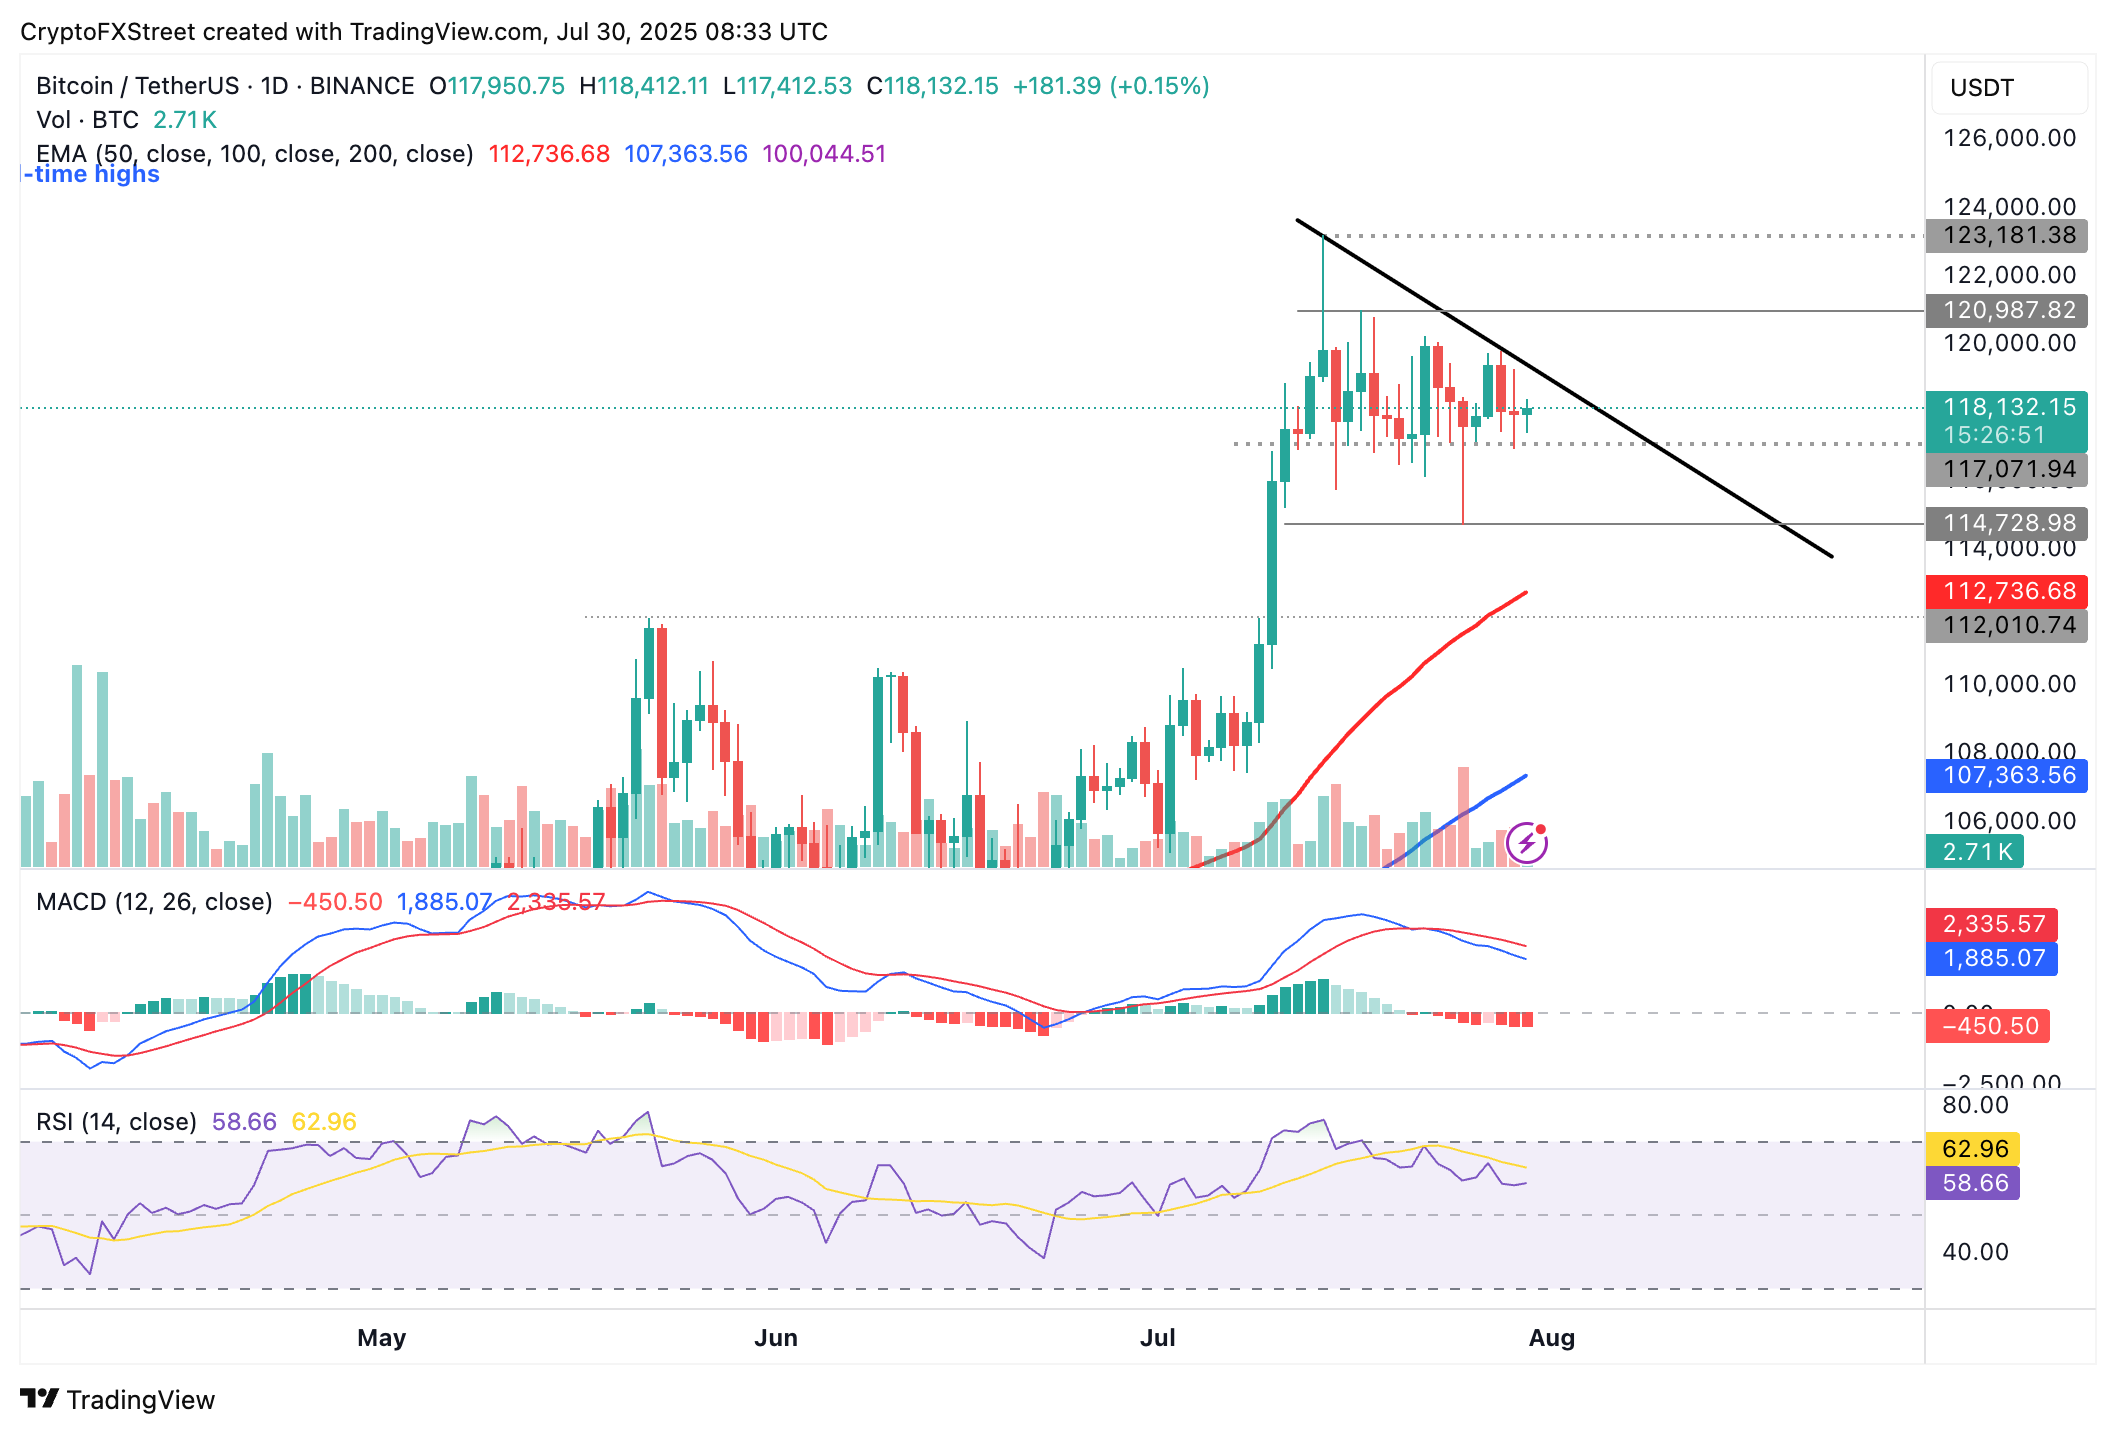
BTC/USDT daily chart
Still, potential positive sentiment from the Fed interest rate decision could boost demand for Bitcoin, which could accelerate the recovery above the $120,000 level and the subsequent move toward the record high.
Altcoins update: Ethereum defies overheated market conditions
Ethereum price rally near the $4,000 milestone was primarily driven by institutional demand and an increase in retail interest. Elevated spot volumes, futures Open Interest (OI), and funding rates continue to bolster the token's upside, which has been sideways around the $3,800 level.
However, the RSI overbought at 74 indicates relatively overheated market conditions, which could lead to a pullback before the next bullish leg. The RSI shows signs of extending the drop below 70, indicating decreasing buying pressure ahead of the Fed event.
The MACD could confirm a sell signal in upcoming sessions if the blue line settles below the red signal line. Traders may be encouraged to reduce exposure, hoping to reenter with new orders at a lower price level. Key levels of interest to traders include $3,500, which was tested on Friday, $3,200 tested as support in January and the 50-day EMA at $3,090.
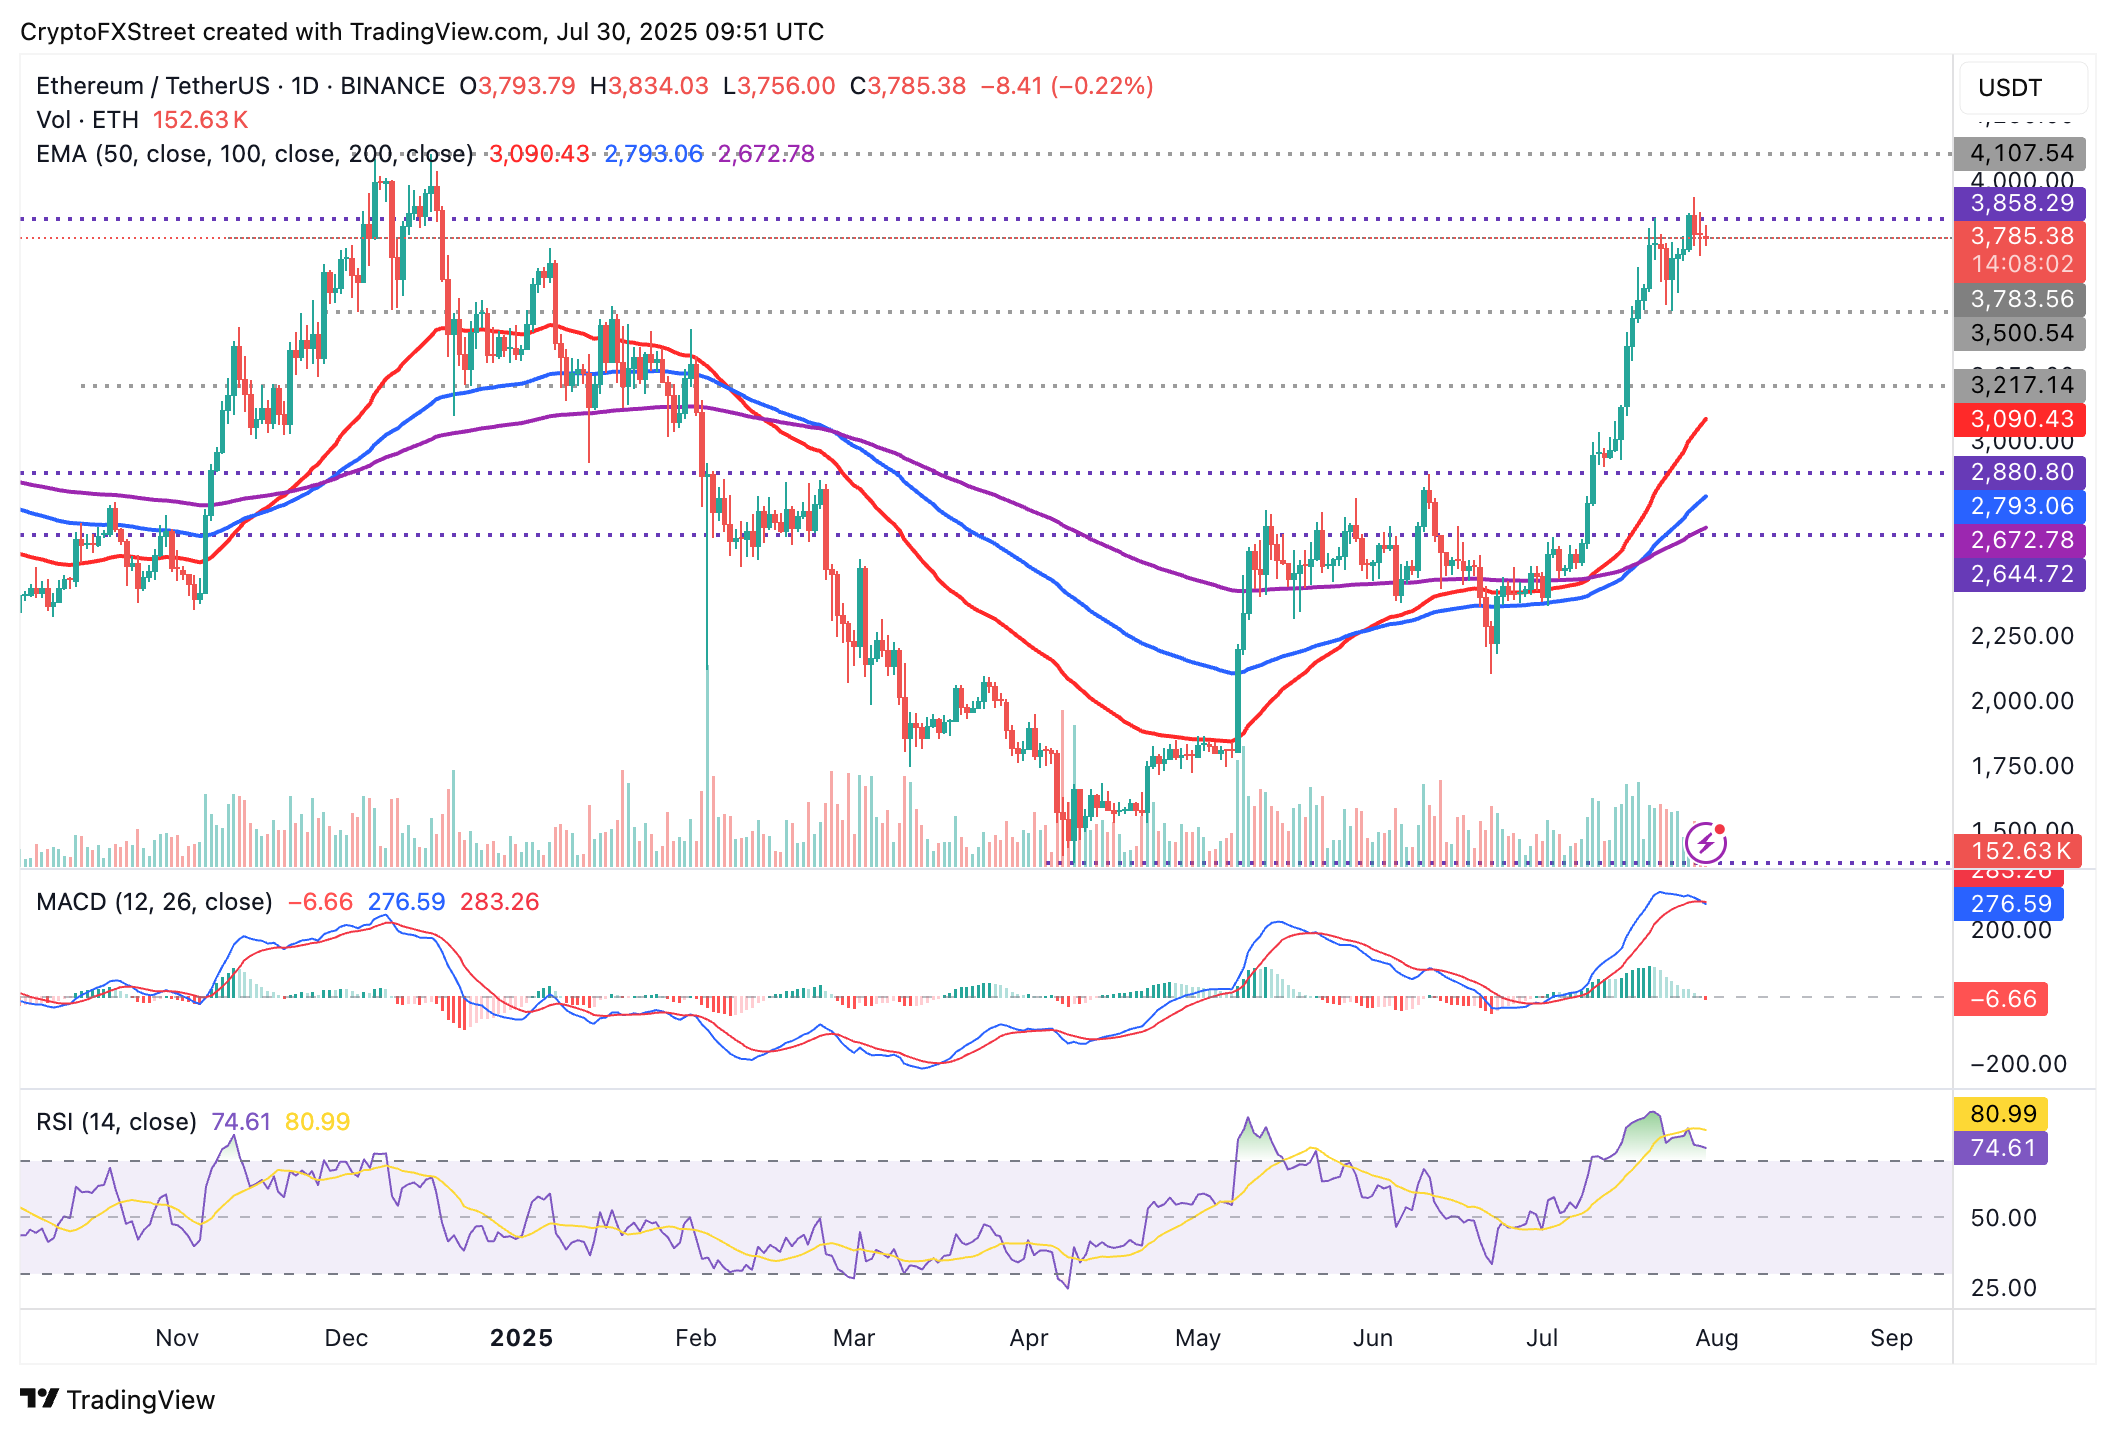
ETH/USDT daily chart
As for XRP, sellers appear to be regaining control, backed by a sell signal from the MACD indicator and the RSI declining at 56 after peaking around 88 during the run-up to the all-time high of $3.66, reached on July 18.
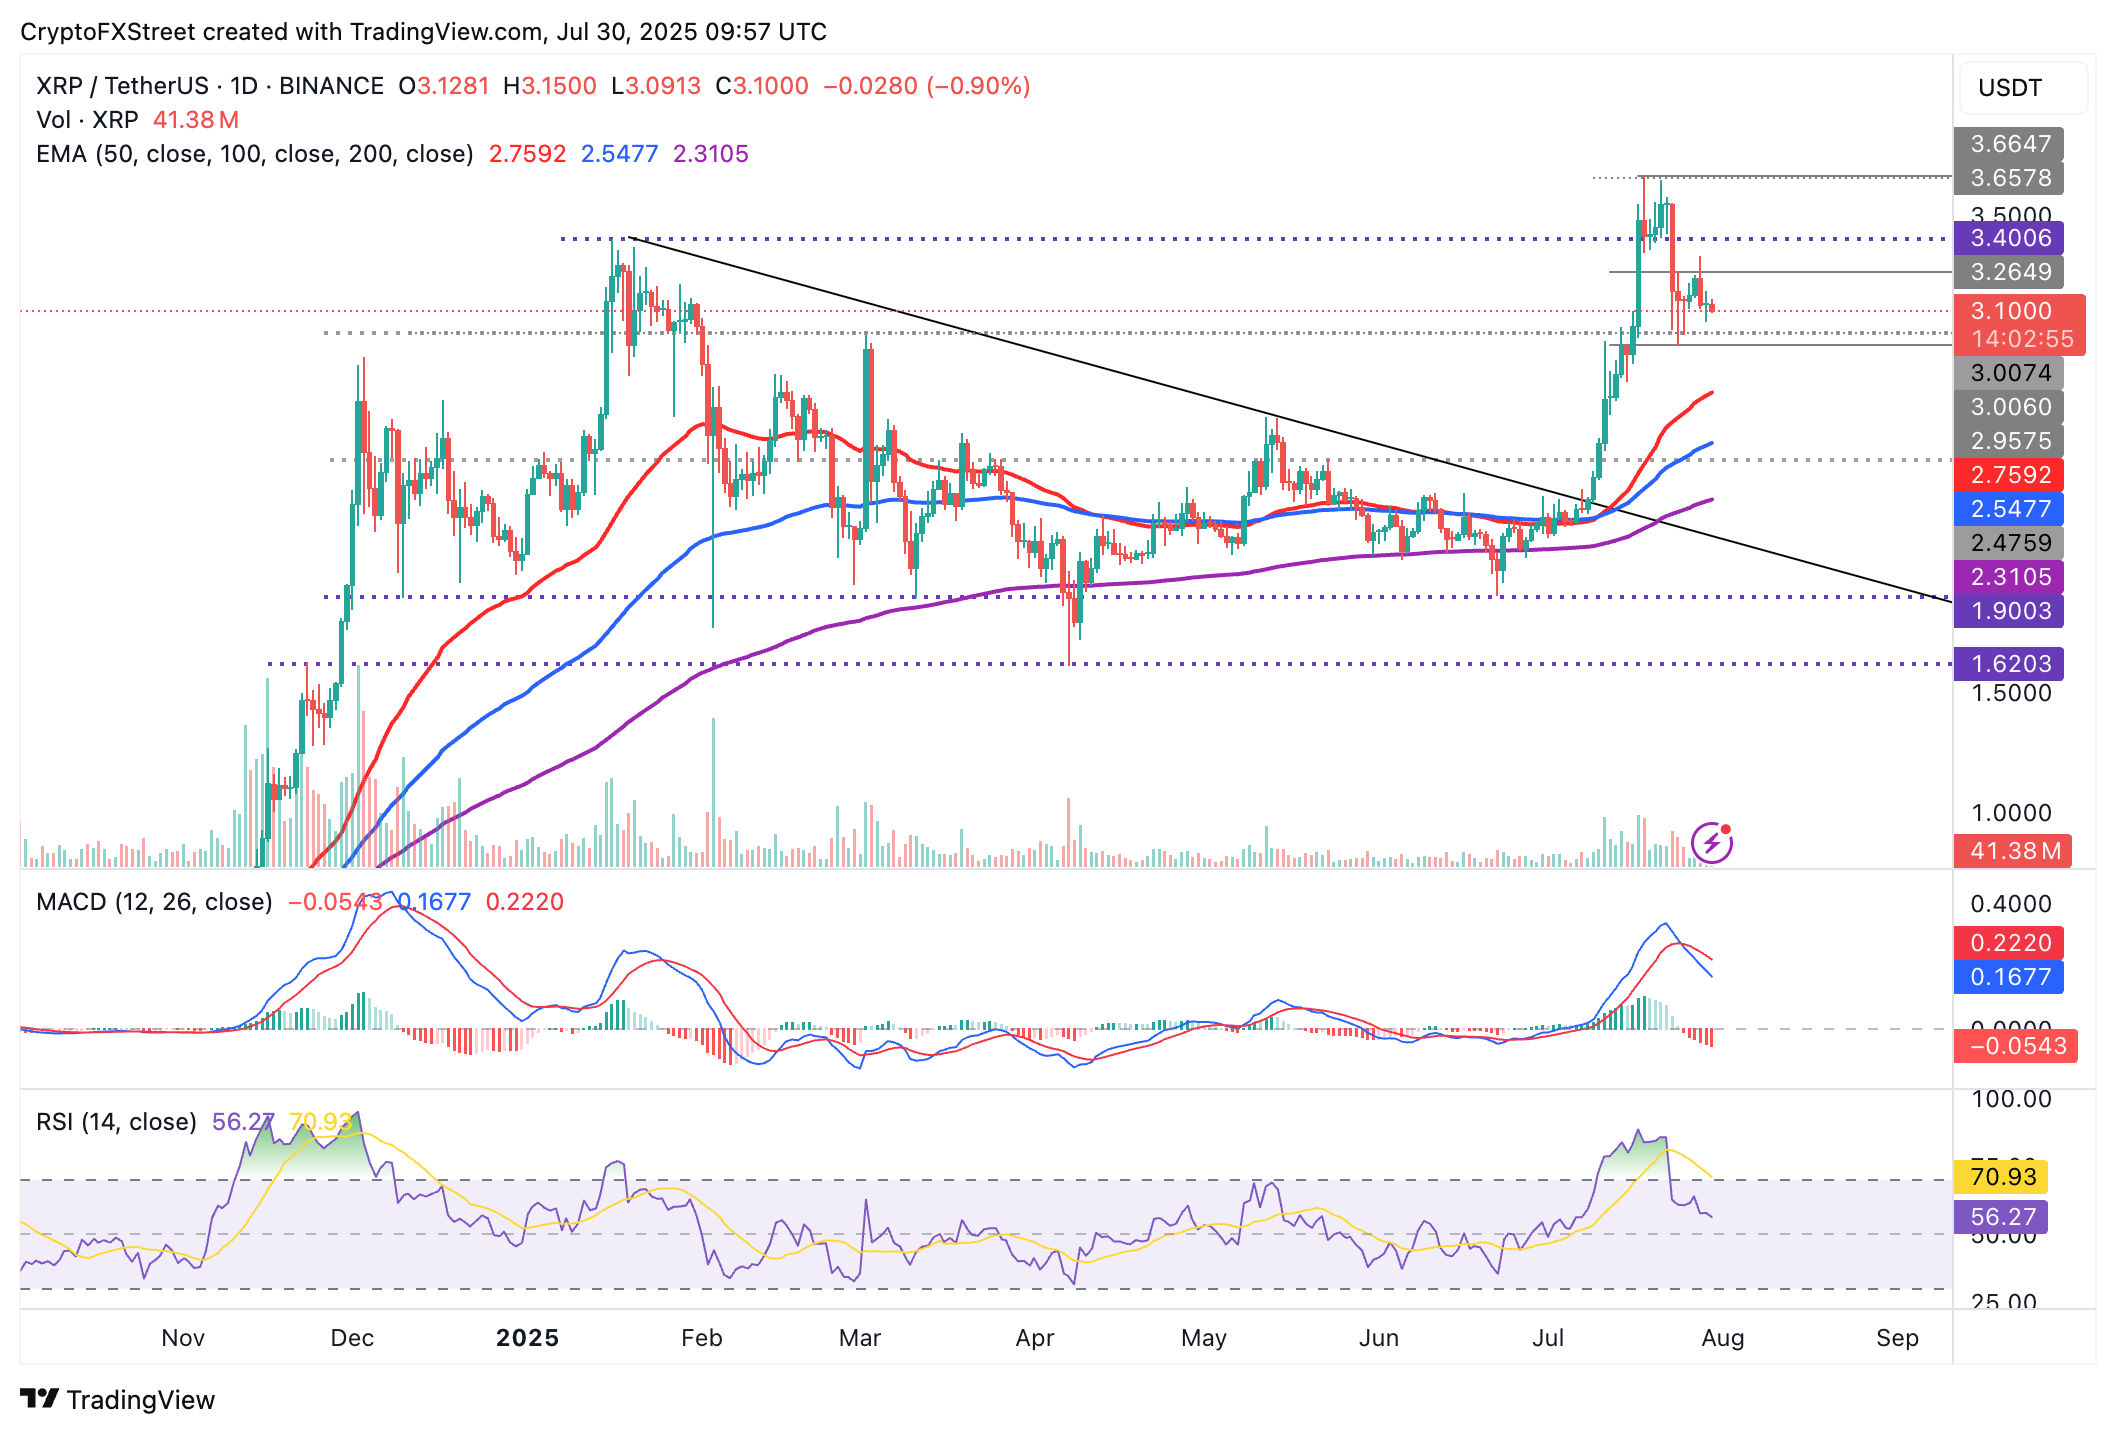
XRP/USDT daily chart
If the trend in the RSI and the MACD indicators continues downward as risks mount, traders will shift their focus to the support range of $2.95 to $3.00. A recovery is possible from here if bulls absorb the selling pressure, buying the dip. However, if sentiment in the broader cryptocurrency market deteriorates, the decline could accelerate toward the 50-day EMA at $2.75.
Bitcoin, altcoins, stablecoins FAQs
Bitcoin is the largest cryptocurrency by market capitalization, a virtual currency designed to serve as money. This form of payment cannot be controlled by any one person, group, or entity, which eliminates the need for third-party participation during financial transactions.
Altcoins are any cryptocurrency apart from Bitcoin, but some also regard Ethereum as a non-altcoin because it is from these two cryptocurrencies that forking happens. If this is true, then Litecoin is the first altcoin, forked from the Bitcoin protocol and, therefore, an “improved” version of it.
Stablecoins are cryptocurrencies designed to have a stable price, with their value backed by a reserve of the asset it represents. To achieve this, the value of any one stablecoin is pegged to a commodity or financial instrument, such as the US Dollar (USD), with its supply regulated by an algorithm or demand. The main goal of stablecoins is to provide an on/off-ramp for investors willing to trade and invest in cryptocurrencies. Stablecoins also allow investors to store value since cryptocurrencies, in general, are subject to volatility.
Bitcoin dominance is the ratio of Bitcoin's market capitalization to the total market capitalization of all cryptocurrencies combined. It provides a clear picture of Bitcoin’s interest among investors. A high BTC dominance typically happens before and during a bull run, in which investors resort to investing in relatively stable and high market capitalization cryptocurrency like Bitcoin. A drop in BTC dominance usually means that investors are moving their capital and/or profits to altcoins in a quest for higher returns, which usually triggers an explosion of altcoin rallies.
Recommended Articles


