
Pi Network Extends Weekly Losses to 15% – What’s Next for PI
Pi Network’s prolonged decline has extended into another week, with the token shedding nearly 16% of its value amid a broader market lull.
As macro uncertainty intensifies and Pi’s scheduled daily token unlocks continue to weigh heavily on sentiment, the downward pressure appears far from over.
Sellers Dominate as PI Falls Below Key Thresholds
Since reaching an all-time high of $3 on February 25, PI has recorded consistent weekly losses, with no significant demand inflows to halt the slide.
On the daily chart, the readings from the token’s Moving Average Convergence Divergence (MACD) indicator reflect the deepening bearish momentum. At press time, PI’s MACD line (blue) rests below the signal line (orange).
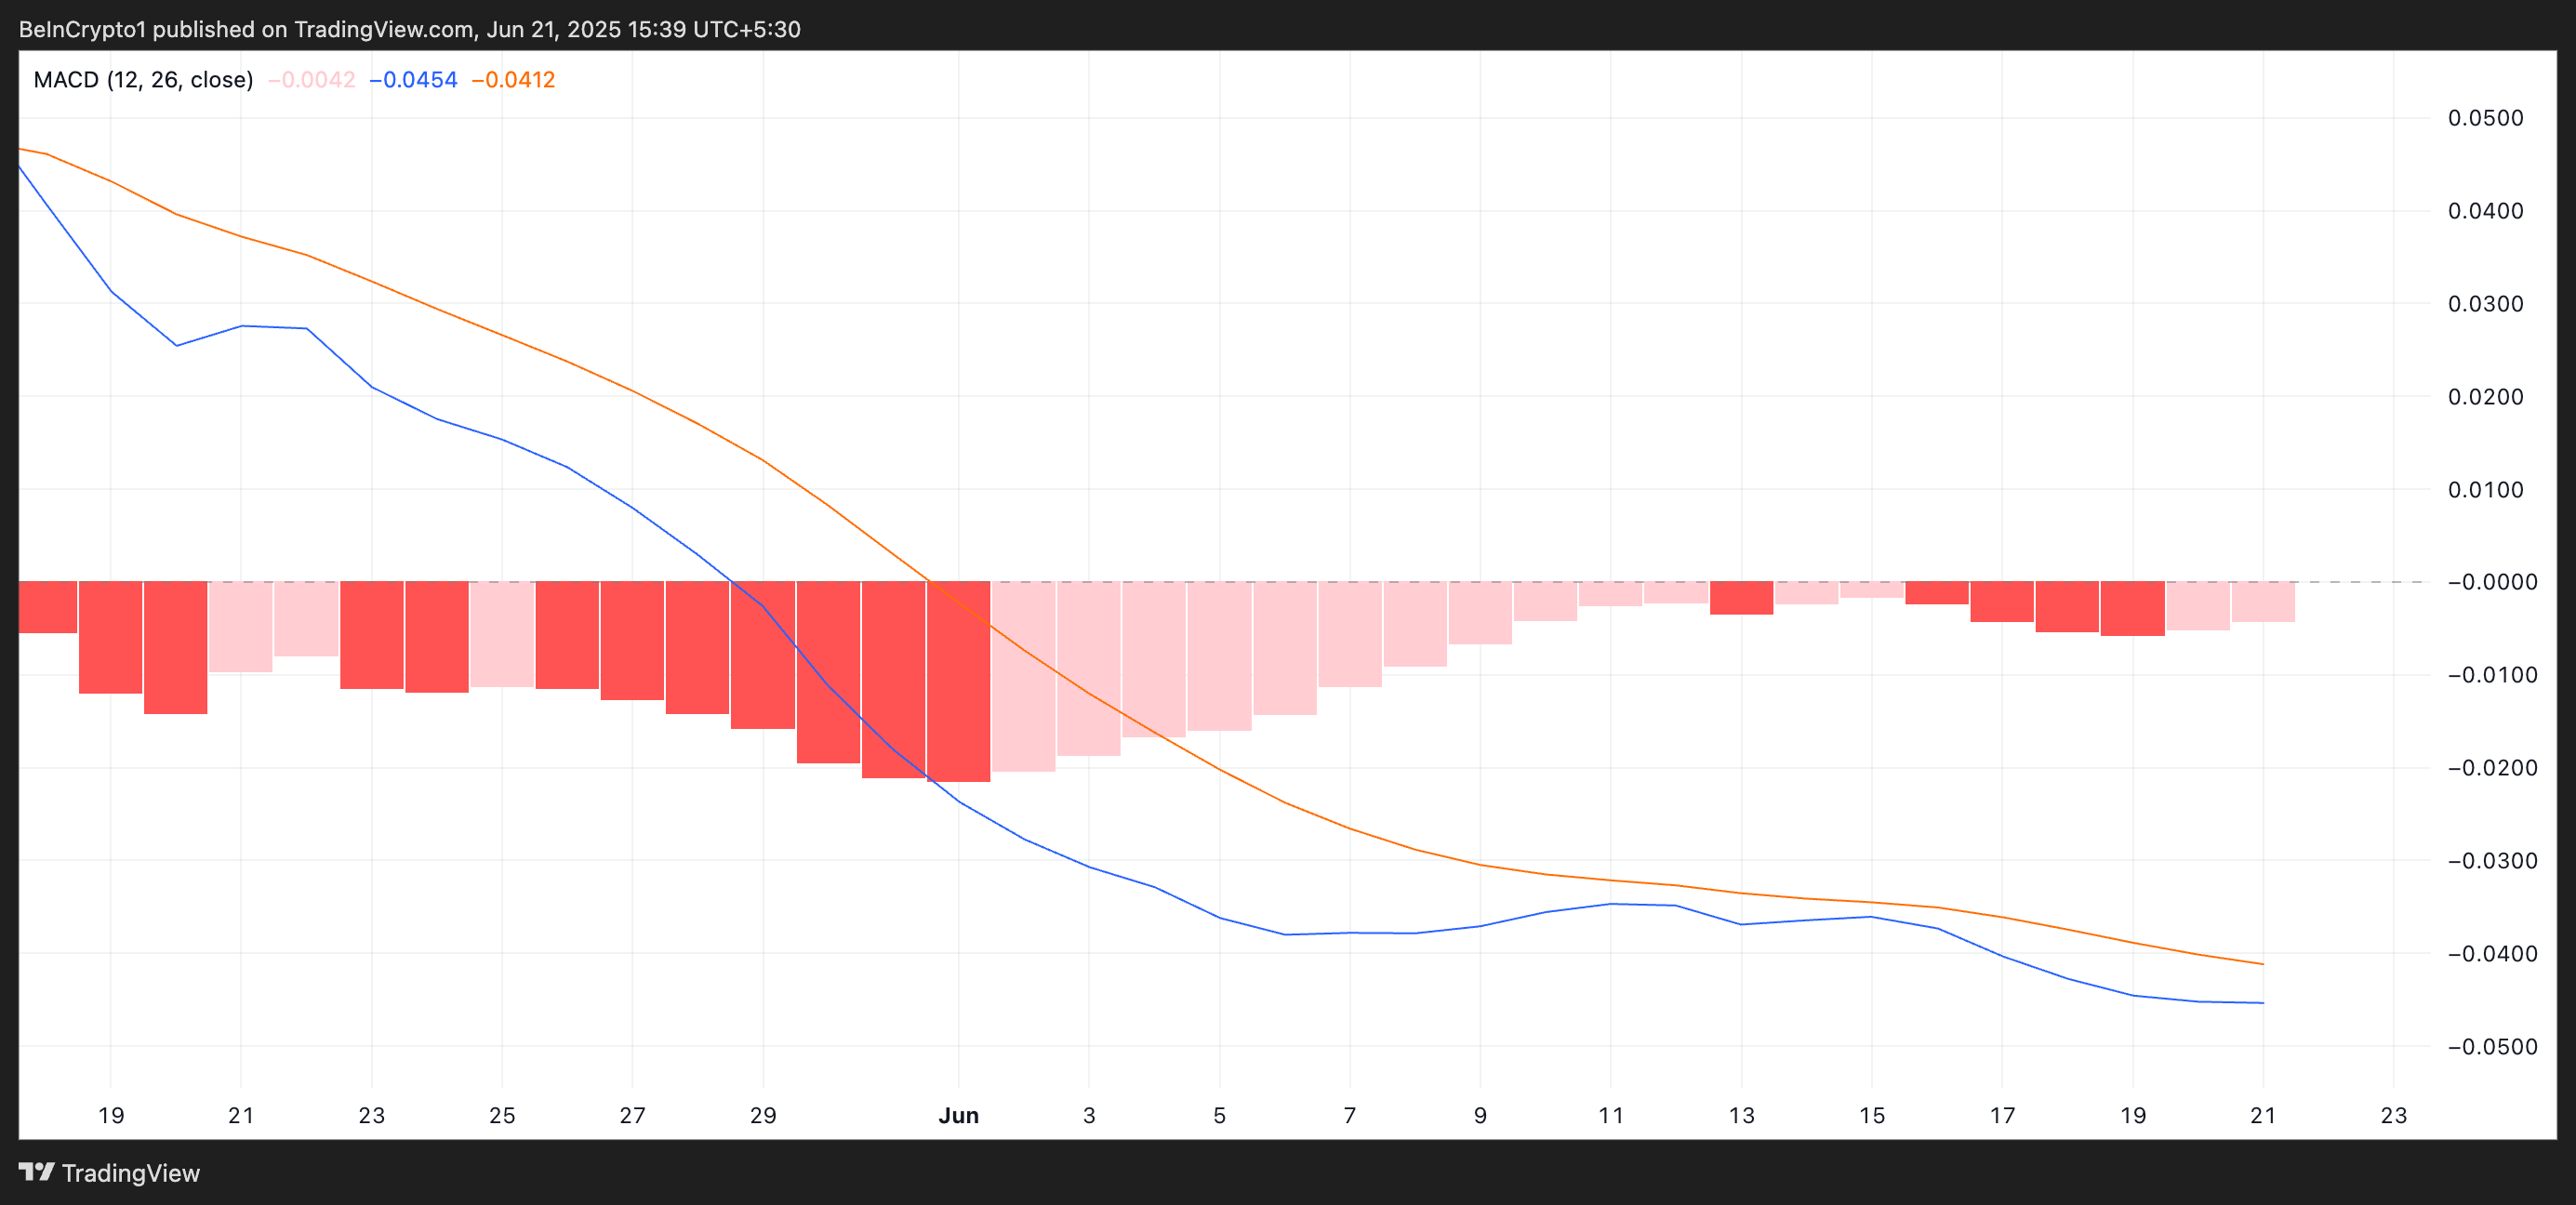 PI MACD. Source: TradingView
The MACD indicator identifies trends and momentum in its price movement. It helps traders spot potential buy or sell signals through crossovers between the MACD and signal lines.
As with PI, when the MACD line rests below the signal line, it indicates waning buying activity. Traders see this setup as a sell signal. Hence, it could exacerbate the downward pressure on PI’s price.
Moreover, PI’s negative Balance of Power (BoP) shows that sellers remain firmly in control. As of this writing, the indicator is at -0.12.
 PI BoP. Source: TradingView
The BoP indicator measures the strength of buyers versus sellers in the market, helping to identify momentum shifts. When its value is positive, buyers dominate the market over sellers and drive newer price gains.
Conversely, negative BoP readings signal that sellers are dominating the market, with little to no resistance from buyers. This points to sustained downward pressure and weakening investor confidence.
For PI, the negative BoP readings reinforce the bearish outlook. It suggests that selling momentum may persist unless new demand emerges.
Pi Network Struggles Below Key EMA Level
Currently, PI trades at $0.53, exchanging hands below its 20-day exponential moving average (EMA), which forms dynamic resistance above its price at $0.56.
The 20-day EMA measures an asset’s average price over the past 20 trading days, giving more weight to recent prices. When an asset’s price trades below its 20-day EMA, it signals short-term bearish momentum and potential continued downside. If the bears retain control, they could drive PI’s price to revisit its all-time low at $0.40.
 PI Price Analysis. Source: TradingView
However, a rebound could push the Pi Network’s token above the 20-day EMA and toward $0.79.
Recommended Articles


