Hyperliquid Price Forecast: HYPE risks breaking $40 support after correction from all-time high
- Hyperliquid risks breaks below $40.00 support after reaching new record highs of $45.72 on Monday.
- Increasing volumes, coupled with a sharp decline in the derivatives market's Open Interest, suggest a decline in interest in HYPE as liquidations mount.
- Hyperliquid's technical structure is showing signs of weakening as the MACD confirms a sell signal.
Hyperliquid's (HYPE) bullish outlook appears to be faltering after it posted new all-time highs of $45.72 on Monday. The high-performance Layer-1 blockchain token is trading at $40.13, down over 3.5% at the time of writing on Tuesday.
Hyperliquid pauses price discovery
Hyperliquid extended gains on Monday, building on positive sentiment likely driven by Bitcoin (BTC)'s brief recovery above the $107,000 resistance. However, potential profit-taking following the uptick to new record highs and tensions in the Middle East due to the conflict between Israel and Iran is shifting sentiment and keeping the broader cryptocurrency market on the edge.
QCP Capital's market update highlights that the composure exhibited by the crypto market "in the face of rising geopolitical risk" is remarkable. However, Hyperliquid risks prolonged losses below the short-term $40.00 support, especially if the derivatives market Open Interest (OI) extends the downtrend.
CoinGlass shows that OI, which represents the number of active futures and options contracts yet to be settled or closed, has declined by nearly 8% to $1.91 billion over the past 24 hours.
The volume surged in tandem by more than 54% to $2.89 billion, underscoring the rising liquidations. Approximately $1.77 million was liquidated in the last 24 hours, with the long position leading with $1.23 million compared to roughly $542,000 in shorts.

Hyperliquid derivatives stats | Source: CoinGlas
A persistent drop in OI would indicate declining interest in HYPE and the lack of trader conviction in the price discovery phase. For now, all eyes are on the ability of support at $40.00 to hold and give way for the resumption of the uptrend or cave in, signaling shifting market dynamics.
Technical outlook: HYPE bears tighten grip
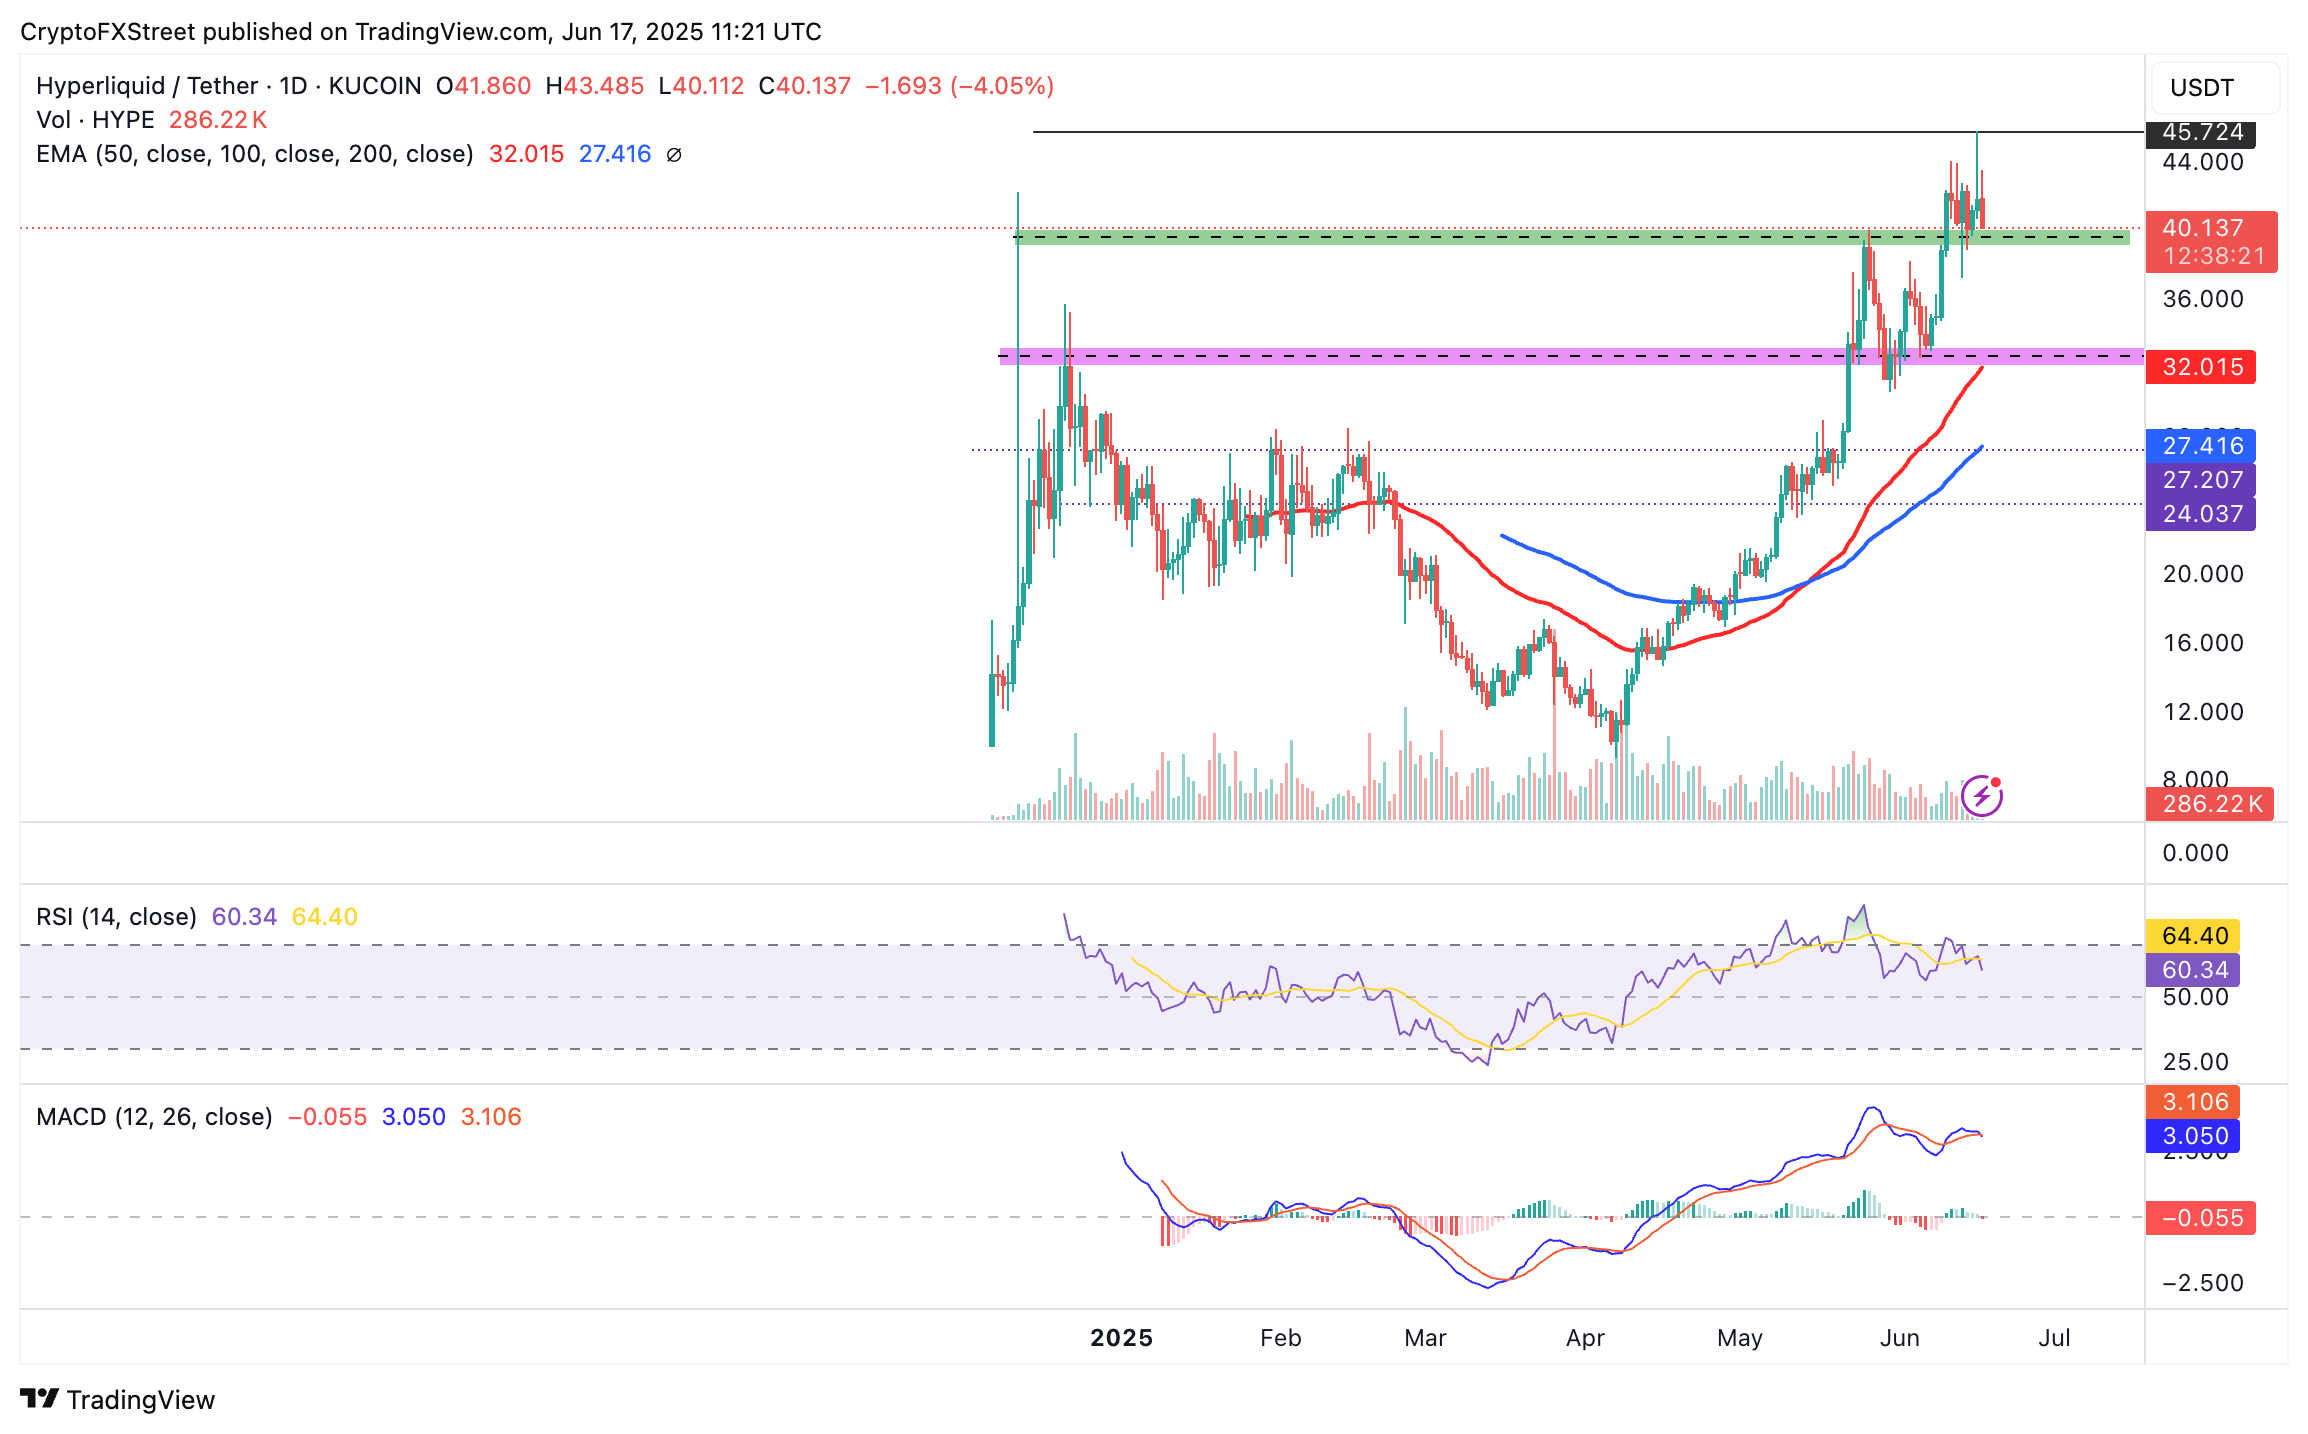
Hyperliquid is trading at around $40.13 at the time of writing, marking a 12% drop from the record high of $40.72, reached on Monday.
The path of least resistance has shifted downward, accentuated by a sell signal from the Moving Average Convergence Divergence (MACD) indicator on the daily chart below.
Traders will look for the blue MACD line to cross below the red signal line to ascertain bearish momentum. The sell signal often encourages traders to reduce exposure to HYPE. This, together with potential profit-taking due to the run-up to new record highs, could accelerate the downswing below the $40.00 support level.

HYPE/USDT daily chart
The Relative Strength Index (RSI) swing below overbought territory, heading toward the 50 midline, signals a firm bearish grip. Key areas of interest under the $40.00 zone, marked green on the chart, include tentative support at around $36.00, the 50-day Exponential Moving Average (EMA) at $32.01 and the 100-day EMA at $27.41.
Open Interest, funding rate FAQs
Higher Open Interest is associated with higher liquidity and new capital inflow to the market. This is considered the equivalent of increase in efficiency and the ongoing trend continues. When Open Interest decreases, it is considered a sign of liquidation in the market, investors are leaving and the overall demand for an asset is on a decline, fueling a bearish sentiment among investors.
Funding fees bridge the difference between spot prices and prices of futures contracts of an asset by increasing liquidation risks faced by traders. A consistently high and positive funding rate implies there is a bullish sentiment among market participants and there is an expectation of a price hike. A consistently negative funding rate for an asset implies a bearish sentiment, indicating that traders expect the cryptocurrency’s price to fall and a bearish trend reversal is likely to occur.
