
Altcoins SPX, DEXE, CAKE post gains, shrugging off Bitcoin’s fall below $105,000
- The broader cryptocurrency market saw altcoins turn red as Bitcoin closed below $105,000 on Wednesday.
- SPX, DEXE, and CAKE hold gains despite strong headwinds, signaling potential upside if the market stabilizes.
- Coinbase adds CAKE to the asset roadmap while DeXe Protocol starts a writer’s guild program.
The broader cryptocurrency market mirrored the bearish close in Bitcoin (BTC) on Wednesday, with the majority of the top 100 altcoins closing below their opening prices. Among the minority, SPX6900 (SPX), DeXe Protocol (DEXE), and PancakeSwap (CAKE) record mild gains as Coinbase adds CAKE to the asset roadmap, increasing the listing chances, and DEXE announces a writer’s guild program to incentivize its promotion.
Bitcoin reveals a vulnerable price action with increasing downside risk as a triangle pattern unfolds. On the 4-hour timeframe, the lows on May 12, May 31, and June 2 compose a support trendline, while the lower high trend in Bitcoin after its reversal from its all-time high of $111,970 on May 22 shapes a declining trendline.
The converging trendlines assemble a triangle pattern while Bitcoin draws near the support floor and the triangle’s apex. A potential 4-hour closing below Wednesday’s low at $104,179 will result in a fallout from the pattern. Investors could witness BTC retest the $103,182 low marked on Saturday, with the next support level at $101,860.
The Relative Strength Index (RSI) at 46 fluctuates near the halfway line a couple of days after the bounce back from the oversold boundary. The indicator shows significant room for growth but an indecisive trend in motion.
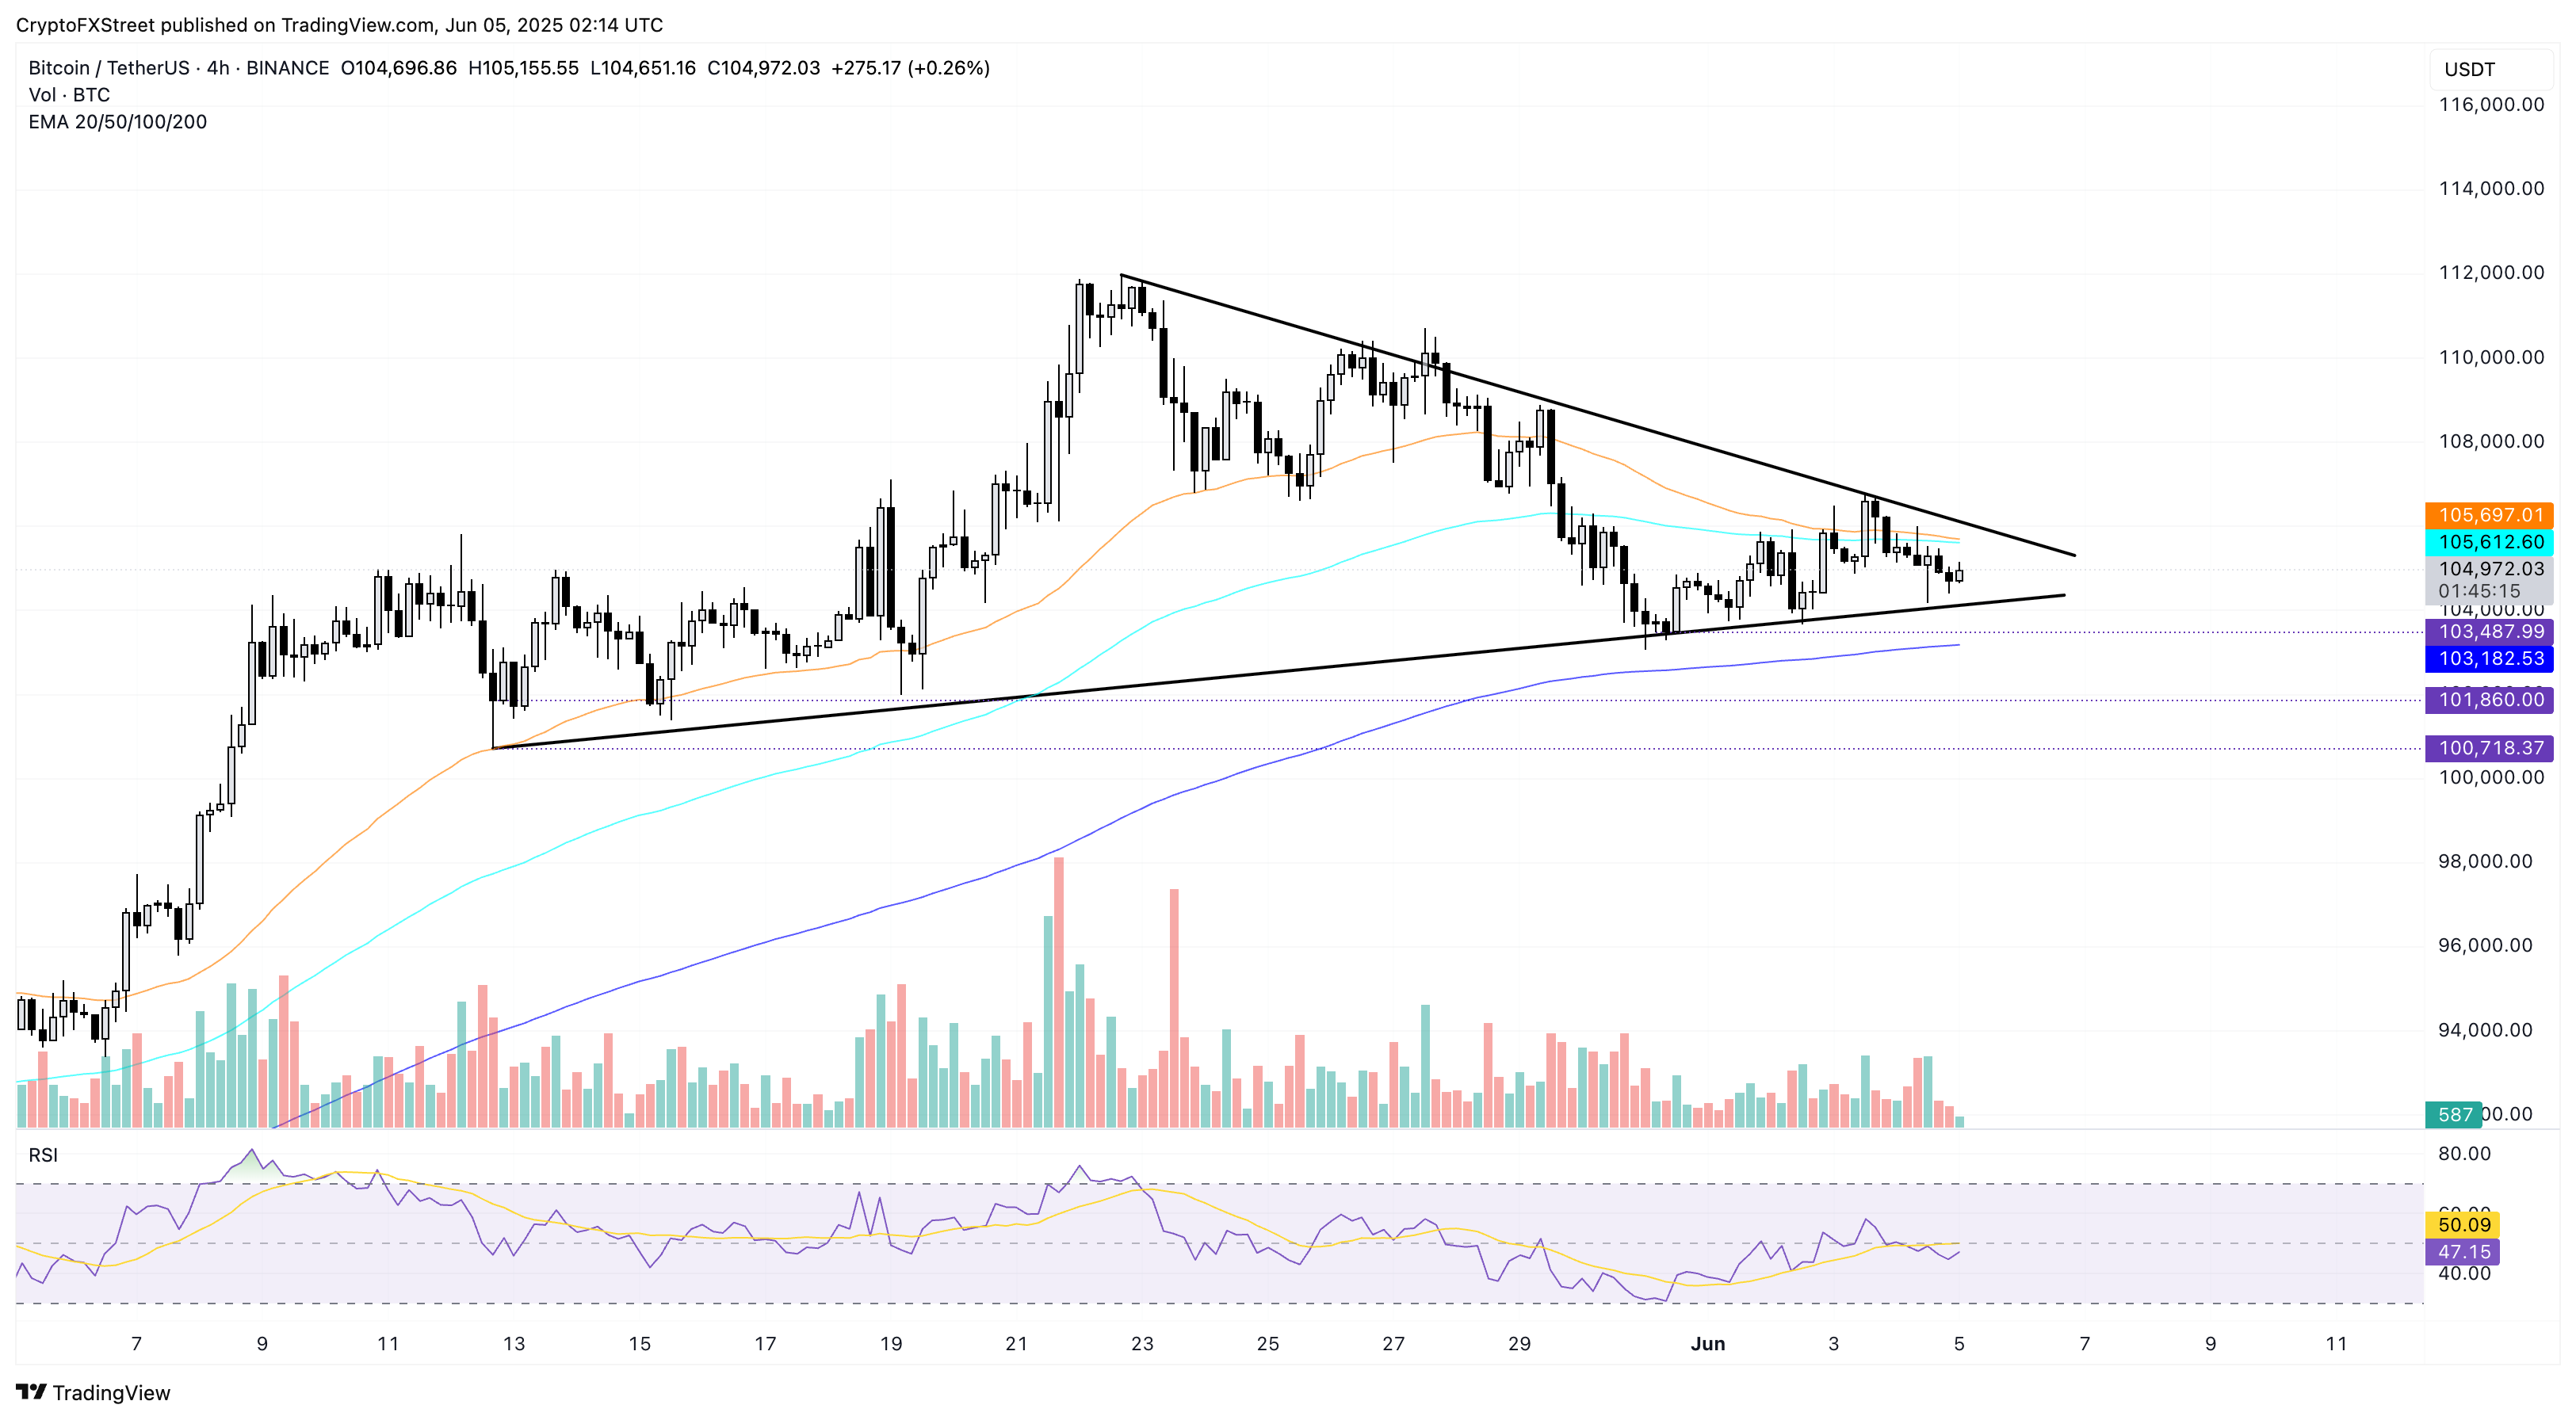
BTC/USDT daily price chart. Source: Tradingview
Conversely, an upside reversal closing above the trendline (Wednesday’s high at $106,000) could move BTC to $108,797.
SPX6900 under reversal risk with bearish RSI divergence
SPX trades at $1.15, recording a growth of over 1.50% at press time on Thursday. Following the 4.30% rise on Wednesday, the meme coin, neglecting the broader market movement, registered a near 28% rise from its weekly low of $0.90 on Saturday.
The 78.6% Fibonacci level at $1.28 acts as the immediate resistance, drawn between 2025’s highest daily closing price at $1.55 on January 6 and the lowest at $0.29 on March 11.
The RSI indicator at 68 indicates a struggle to enter the overbought zone, as it forms lower highs near the boundary line, resulting in bearish divergence with the rising SPX trend. This warns of an early reversal before reaching the most immediate resistance level as trend momentum declines.
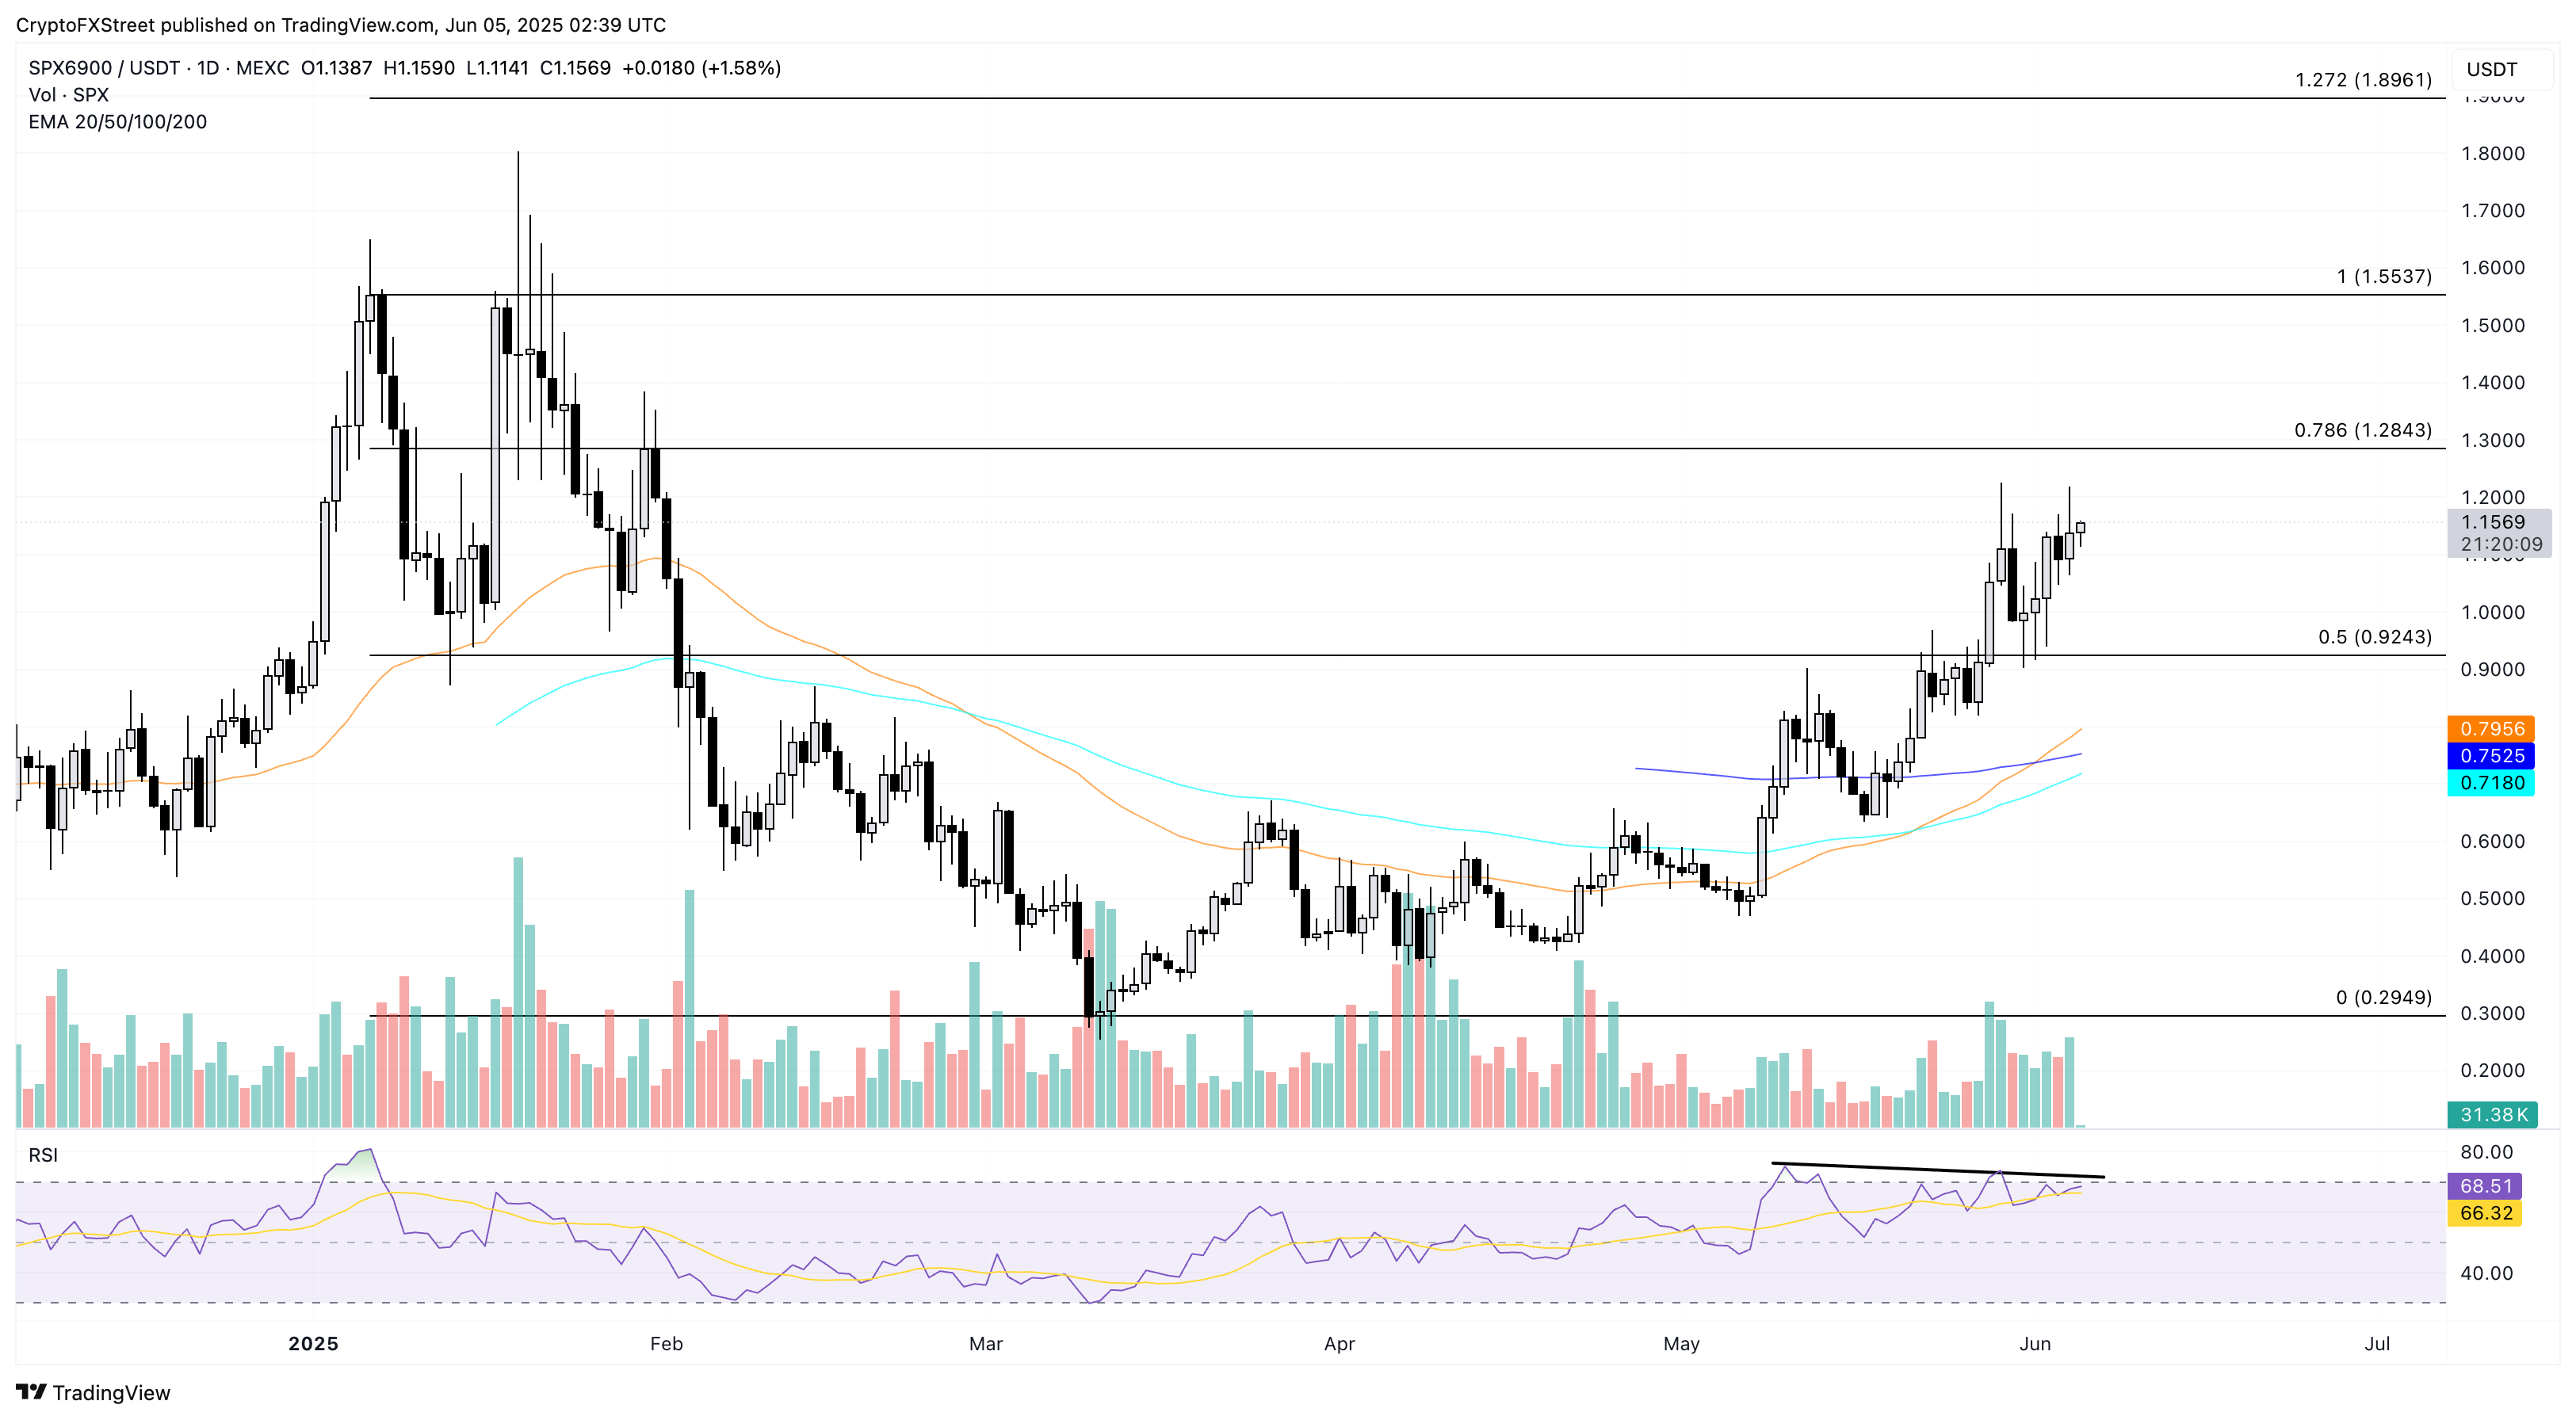
SPX/USDT daily price chart. Source: Tradingview
On the flip side, a downside move in SPX could test the 50% retracement at $0.92.
DEXE’s dead cat bounce
DEXE records a 10% recovery on Wednesday, following a 32% crash on Monday, which resulted in a massive bearish candle on the daily chart. At the time of writing, the altcoin trades at $9.70, taking a breather with over 1.50% pullback in the day.
The failed trendline breakout in DEXE took a downside reversal from the 200-day Exponential Moving Average (EMA) at $14.02. Further up, the RSI indicator drops to the oversold zone and hovers near the boundary line with the short-term recovery.
Thus, the short-term recovery in DEXE fails to change the bearish narrative influenced by the recent crash and warns of a steeper decline to the next support level at $7.33.
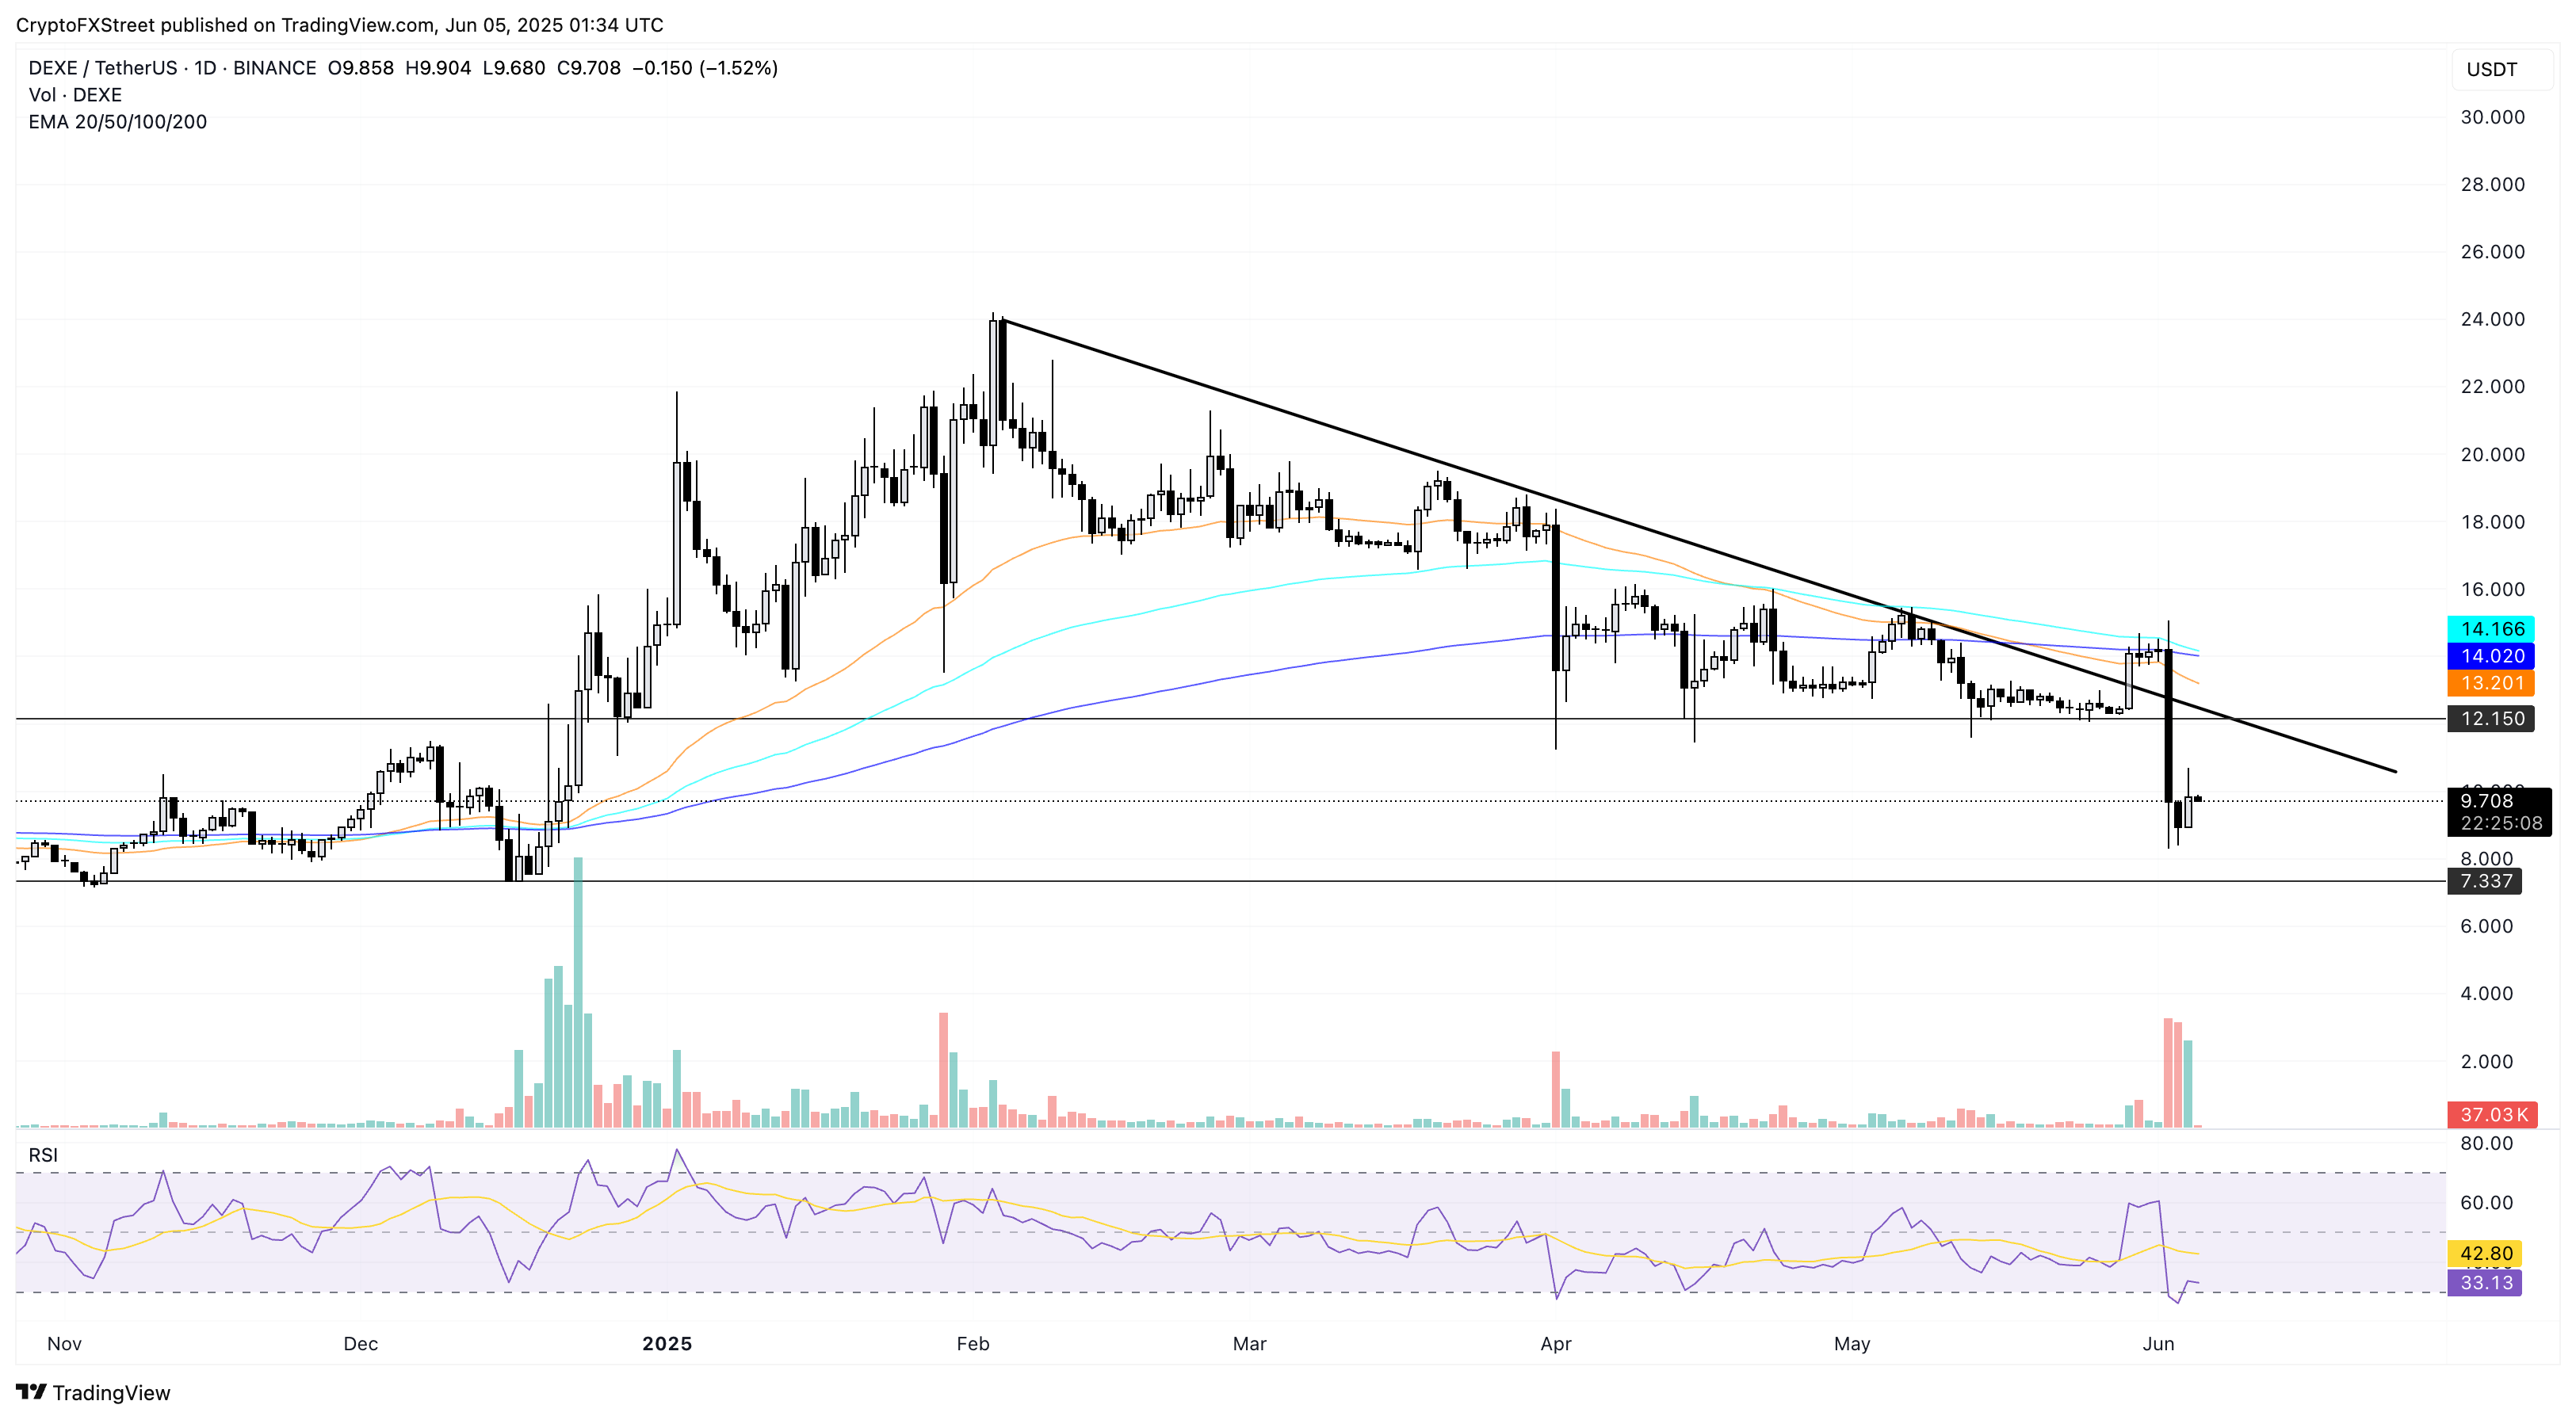
DEXE/USDT daily price chart. Source: Tradingview
On the upside, a potential uptrend could retest the broken support floor at $12.15.
CAKE holds an uptrend with the Coinbase listing announcement
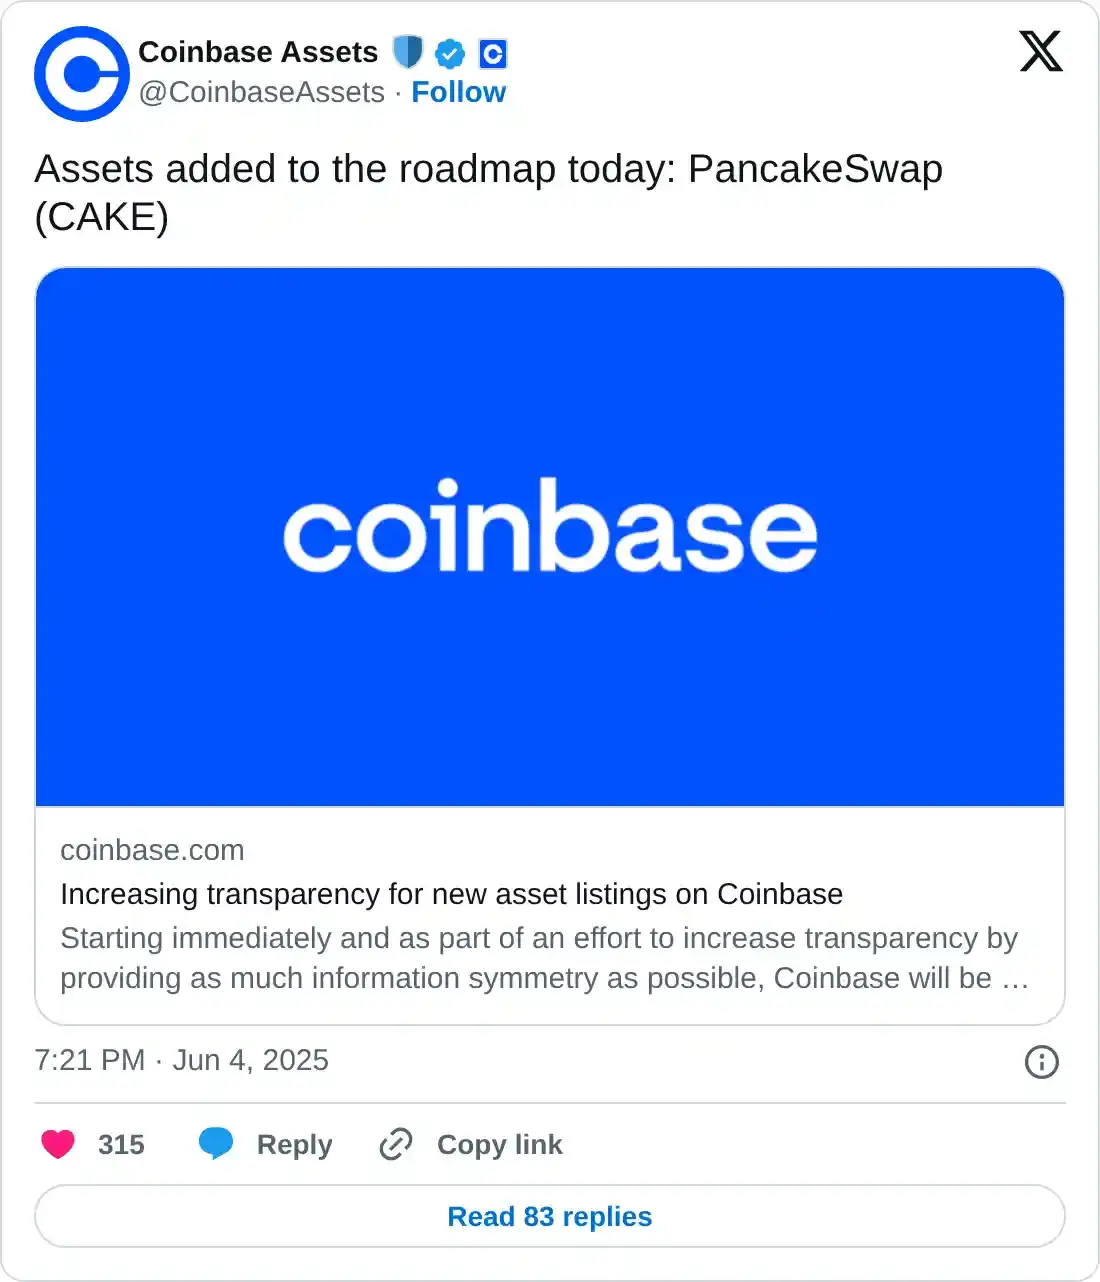
CAKE is up over 3% in the last 24 hours at press time amid the Coinbase announcement of adding PancakeSwap to the asset roadmap after Ethena this week. While the trading date is yet to be confirmed, heightened sentiments are likely to fuel the uptrend if the market stabilizes.
At the time of writing, the altcoin trades at $2.46 with an over 1.50% jump in the day. The price action shows an upside turnaround from the weekly low at $2.21 on Saturday from a long-standing support trendline (formed by connecting the lows on March 11, April 6, and May 4). An upside continuation could challenge the $2.82 resistance level that has resulted in four bearish turnarounds so far in 2025.
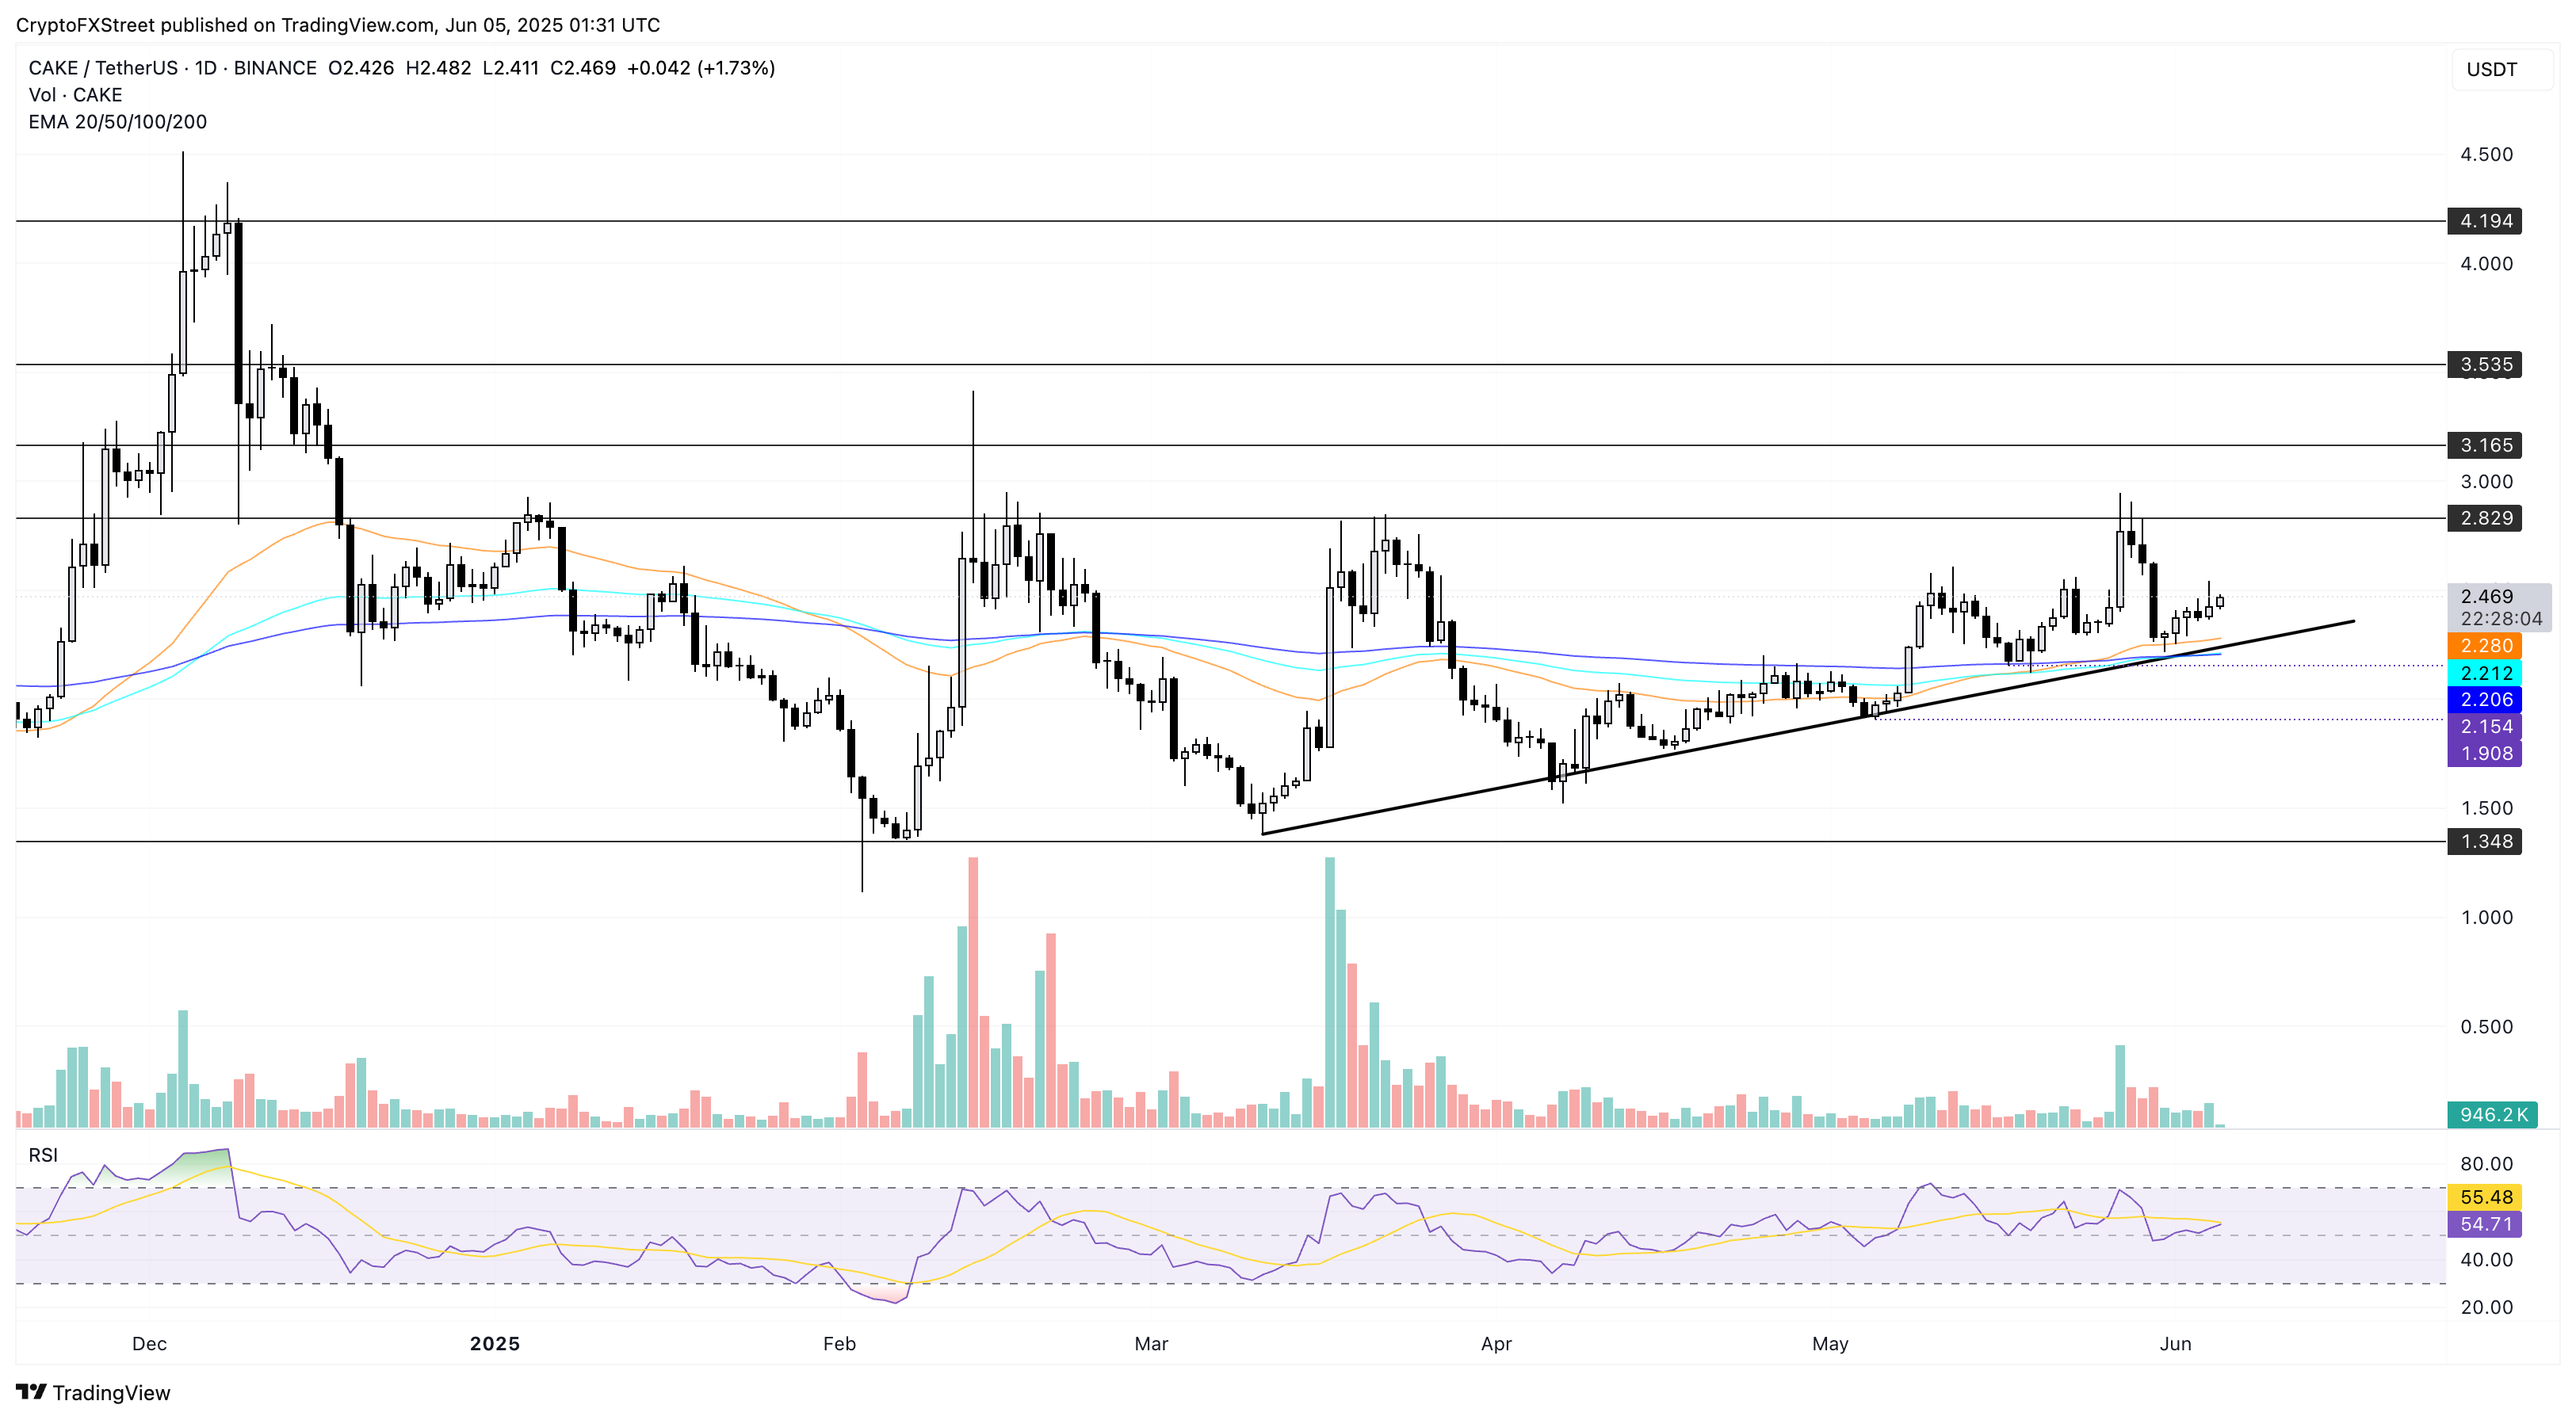
CAKE/USDT daily price chart. Source: Tradingview
On the flip side, a crucial support for the altcoin remains the 200-day EMA at $2.20, moving close to the support trendline.
Recommended Articles


