


XRP Price Explosion To $5.9: Current Consolidation Won’t Stop XRP From Growing
The XRP price is once again in the spotlight as a new technical analysis indicates that the cryptocurrency may be on the verge of a significant price explosion to $5.9 and beyond. According to the analyst behind this forecast, XRP’s recent price behavior is not a sign of weakness but rather a period of strategic consolidation that is building momentum for the next major surge.
Consolidation Phase To Fuel XRP Price Explosion
Master Ananda, a crypto analyst on TradingView, released a detailed analysis of XRP on May 15. The analysis highlights the cryptocurrency’s current price action and predicts its next bullish move. Starting with its historical price behavior, the analysis highlights a strong rally that took place in 2024, particularly around November and December, when XRP printed long green candles that indicated strong momentum.
After reaching a high, XRP entered a consolidation phase, during which price action formed a pattern resembling a symmetrical triangle or wedge. This is marked with red dashed lines on the chart, showing indecision in the market as the price was suppressed.
Master Ananda revealed that after this triangle formation, XRP broke out around April 7, 2025 — a date now marked as a potential inflection point in the cryptocurrency’s market cycle. Since then, weekly candles have consistently closed in the green, indicating renewed bullish momentum.
Adding to Master Ananda’s bullish case for the XRP price is a Fibonacci retracement and extension levels drawn from the previous major swing high to the recent low. These levels help identify potential resistance and target zones for the next leg up.
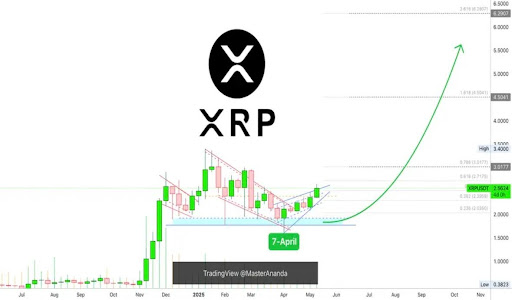
Notably, the retracement levels have been marked around $2.05 (0.236 Fib), $2.39 (0.382 Fib), and $2.71 (0.618 Fib), culminating at the previous high of $3.40. Fibonacci extension project potential targets are at $4.50 (1.618 Fib), and the highest level is at $6.29 (2.618 Fib).
Currently, the trajectory of the curved green arrow in the chart shows a more probable price target of around $5.9. However, XRP will still have to surge past the aforementioned retracement levels and the resistance at $4.5 to reach this level. The overall takeaway of this analysis is that XRP is printing strong bullish signals, and its current consolidation is seen as a precursor to further growth.
The asset Approaches Make Or Break Zone
XRP is entering a decisive phase, as crypto analyst Egrag Crypto predicts an imminent breakout from a tight consolidation range, within which the cryptocurrency has been trading for months. The analyst’s chart shows a purple zone, which he described as a “pandora box.” This zone represents a critical price range acting as both resistance and support, effectively trapping price action.
Egrag Crypto emphasizes that a breakout above or below this boxed range could ignite high volatility and significant momentum for XRP. He frames it as a pivotal moment where big moves, possibly explosive ones, are expected to happen.
Recommended Articles


