

Top 3 Price Prediction: BTC struggles below key resistance, ETH and XRP eye further weakness

- Bitcoin Drops to $70,000. U.S. Government Refuses to Bail Out Market, End of Bull Market or Golden Pit?
- Gold rallies further beyond $5,050 amid flight to safety, dovish Fed expectations
- Bitcoin Bottom Debate: $70,000 or $50,000?
- A Crash After a Surge: Why Silver Lost 40% in a Week?
- Bitcoin Slips Below 75,000 Mark. Will Strategy Change Its Mind and Sell?
- Bitcoin Rout. Bridgewater Founder Dalio Publicly Backs Gold.

Bitcoin hovers around $108,500 on Wednesday after facing rejection from the 50-day EMA at $113,621 the previous day.
Ethereum trades below resistance at $4,151, signaling weakness and hinting at a correction ahead.
XRP nears key support level at $2.35, a firm close below suggests further downleg.
Bitcoin (BTC) price steadies around $108,500 at the time of writing on Wednesday, after facing rejection from the key resistance level the previous day. Ethereum (ETH) and Ripple (XRP), following BTC’s footsteps, are signaling weakness and hinting at a correction ahead.
Bitcoin faces rejection from the 50-day EMA
Bitcoin price found support around the 61.8% Fibonacci retracement at $106,453 (drawn from the April low of $74,508 to the record high of $126,199) on Saturday and recovered by nearly 4% by Monday. However, on Tuesday, BTC faced rejection from the 50-day Exponential Moving Average (EMA) at $113,606, declining 2%. At the time of writing on Wednesday, BTC trades at around $108,100.
If BTC continues its correction, it could decline toward the 61.8% Fibonacci retracement at $106,453. A successful close below this level could extend additional losses toward the October 10 low of $102,000.
The Relative Strength Index (RSI) on the daily chart reads 40, below the neutral level of 50, indicating bearish momentum gaining traction. The Moving Average Convergence Divergence (MACD) also showed a bearish crossover last week, which remains in effect, further supporting the bearish view.
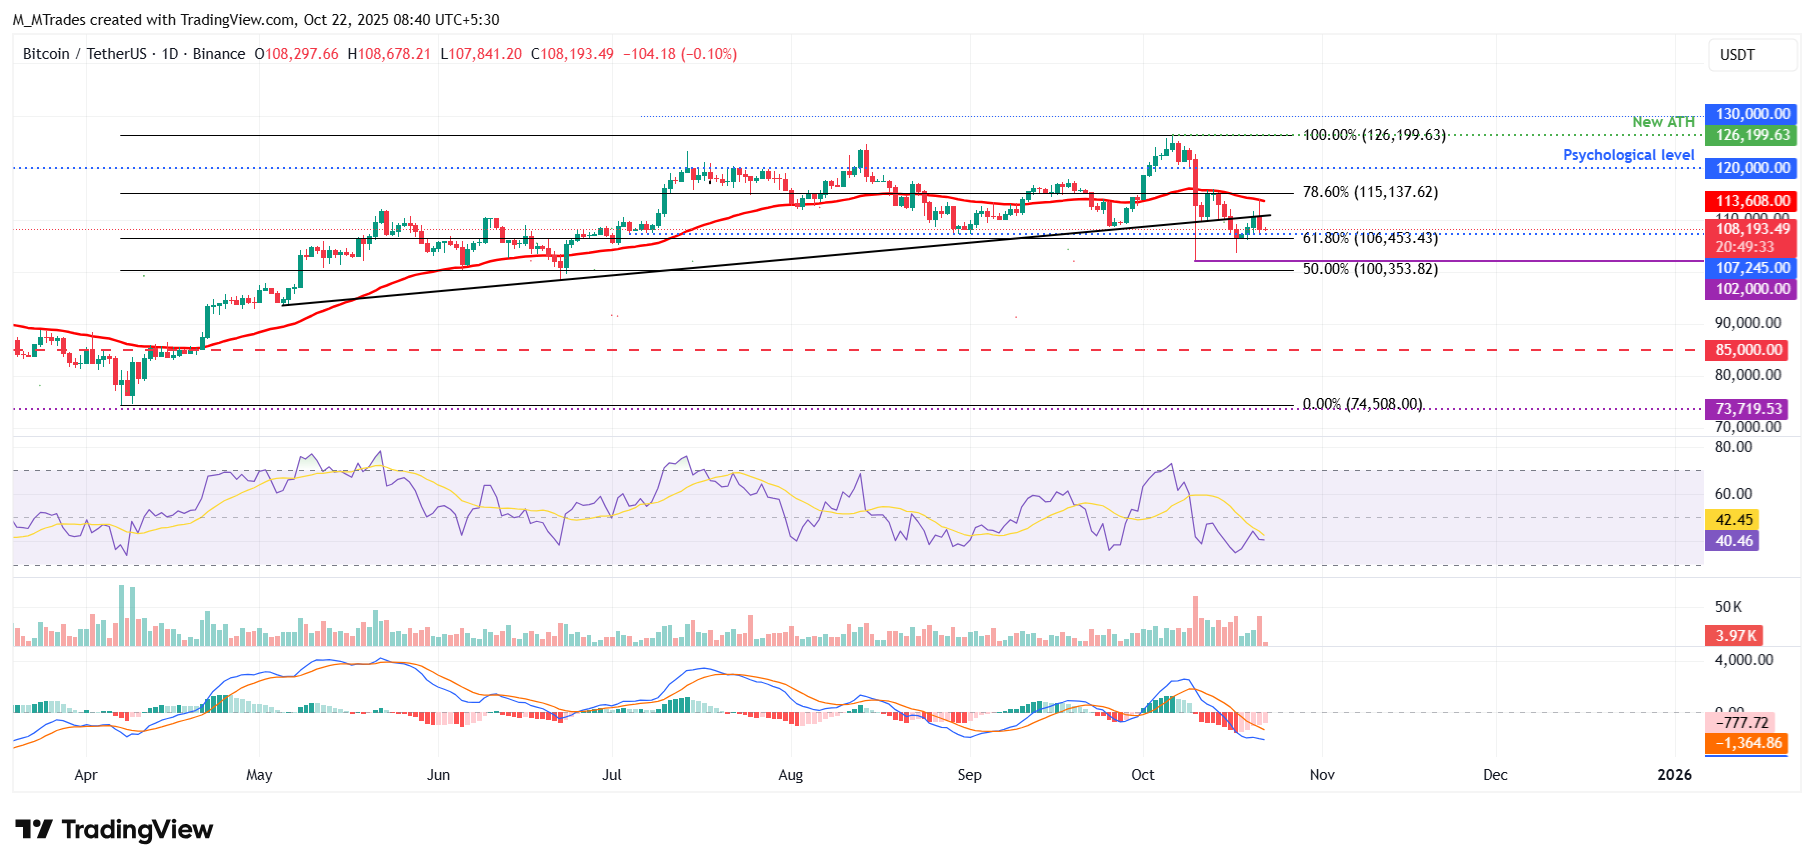
BTC/USDT daily chart
On the other hand, if BTC recovers and closes above the ascending trendline, it could extend the recovery toward the 50-day Exponential Moving Average (EMA) at $113,608.
Ethereum continues its downleg as it faces rejection around key level
Ethereum price corrected by over 4% last week after facing rejection from the daily resistance at $4,232. At the start of this week, ETH continued its correction by 3% until Tuesday. At the time of writing on Wednesday, ETH trades at around $3,847.
If ETH continues its downward momentum, it could extend the decline toward the 61.8% Fibonacci retracement level at $3,593, which coincides with the 200-day EMA.
Like Bitcoin, Ethereum’s RSI and MACD indicators also support the bearish view.
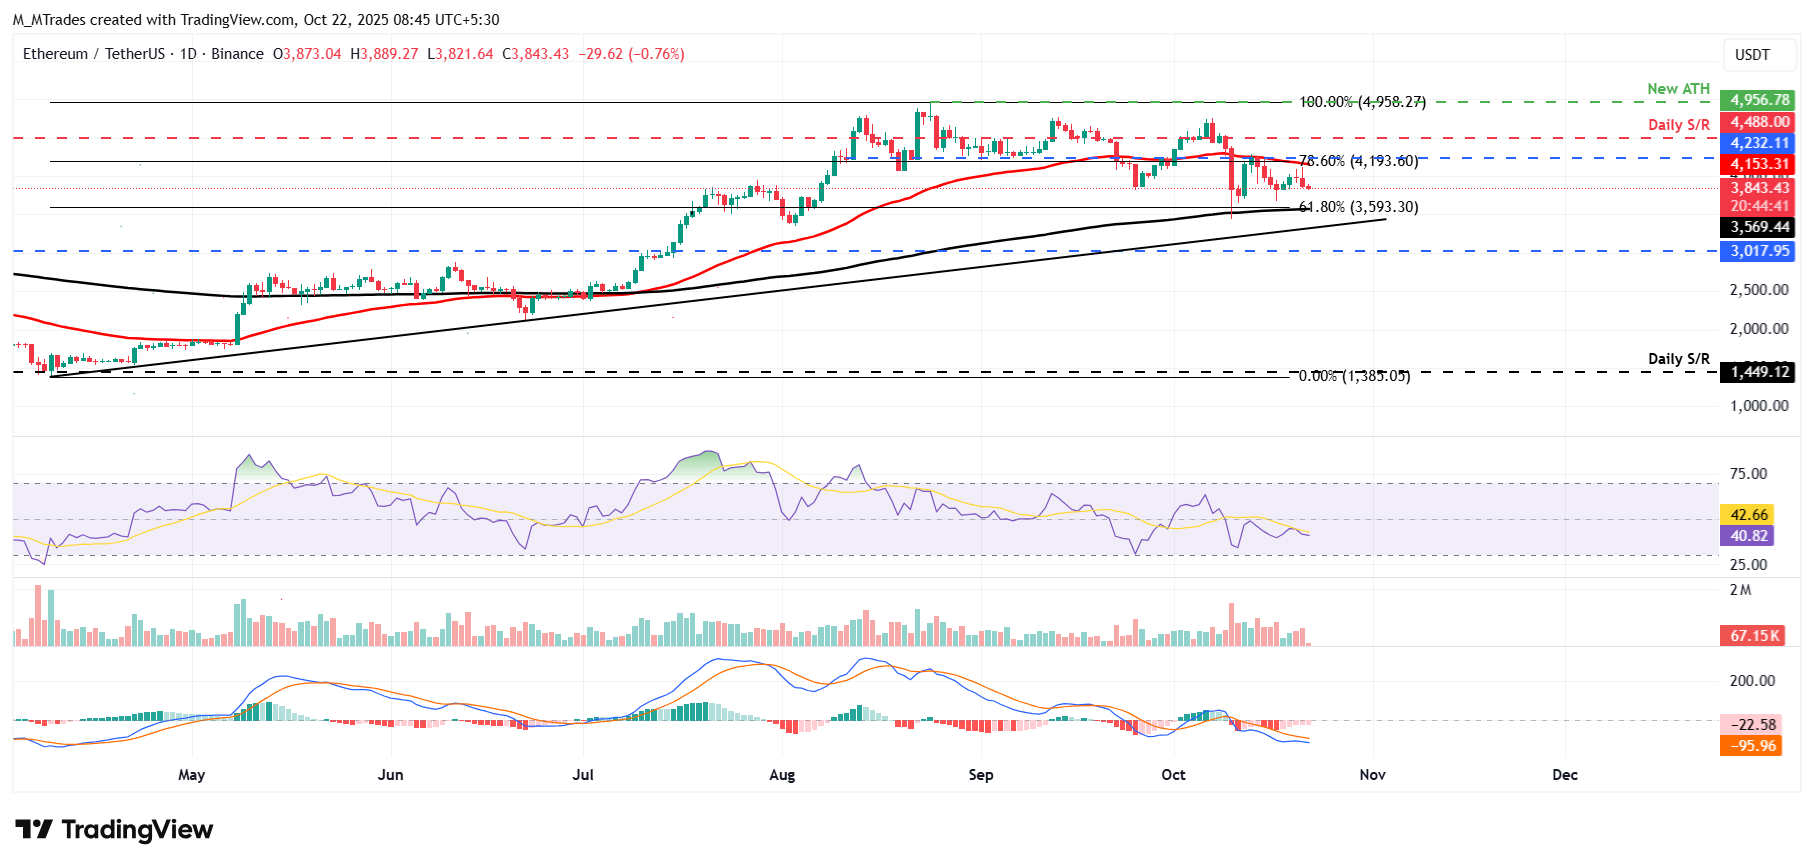
ETH/USDT daily chart
However, if ETH recovers, it could extend the recovery to retest its daily resistance level at $4,232.
XRP could extend its correction if it closes below $2.35 mark
XRP price corrected more than 5% last week after facing resistance around the lower trendline of a falling wedge pattern. On Monday, XRP recovered and closed above the daily resistance at $2.35. However, XRP declined by nearly 3% the next day. At the time of writing on Wednesday, XRP trades at $2.41, nearing the support level.
If XRP fails to find support around the $2.35 and closes below, it could extend the decline toward the next daily support at $1.96.
Like Bitcoin and Ethereum, XRP’s RSI also supports the bearish view.
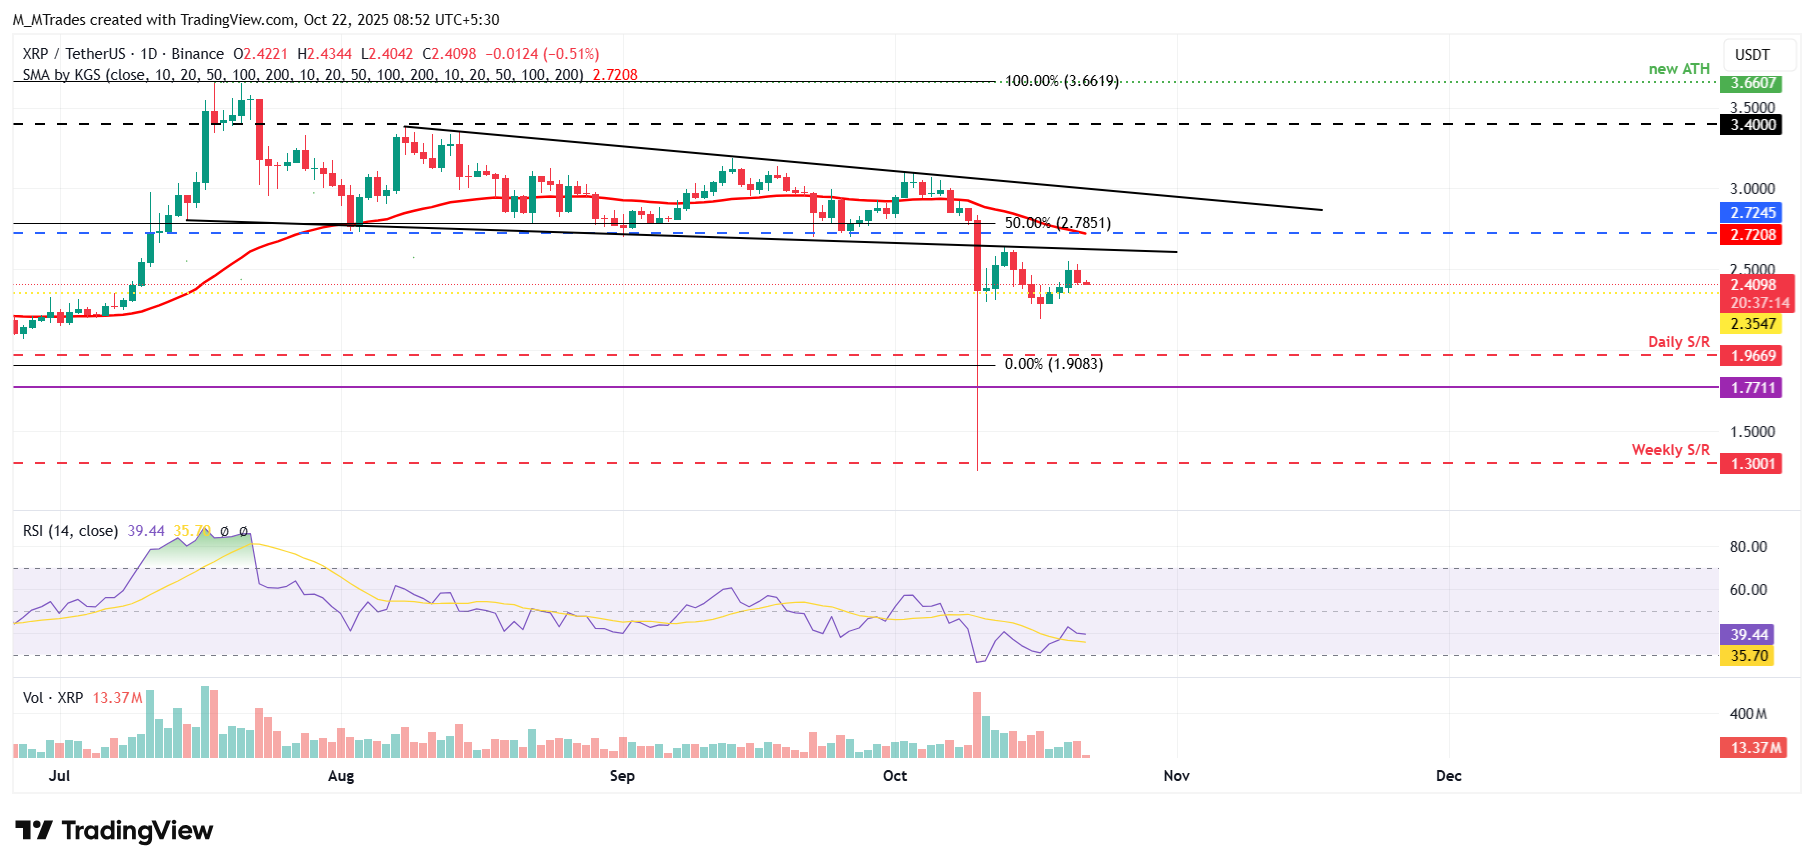
XRP/USDT daily chart
On the other hand, if XRP recovers, it could extend the recovery toward the 50-day EMA at $2.72.
Read more
* The content presented above, whether from a third party or not, is considered as general advice only. This article should not be construed as containing investment advice, investment recommendations, an offer of or solicitation for any transactions in financial instruments.


