
FARTCOIN’s 250% Rally Faces Potential End as Buyers Near Exhaustion
The Solana-based meme coin FARTCOIN has emerged as an unlikely outperformer over the past month. The altcoin has defied the broader market troubles and surged by nearly 250% in the past 30 days.
However, buyer exhaustion could soon set in, potentially triggering a wave of profit-taking among FARTCOIN holders eager to lock in gains.
FARTCOIN Enters Overbought Zone
FARTCOIN’s triple-digit rally has pushed its price above the upper band of its Bollinger Bands (BB) indicator, a sign that the meme coin is overbought.
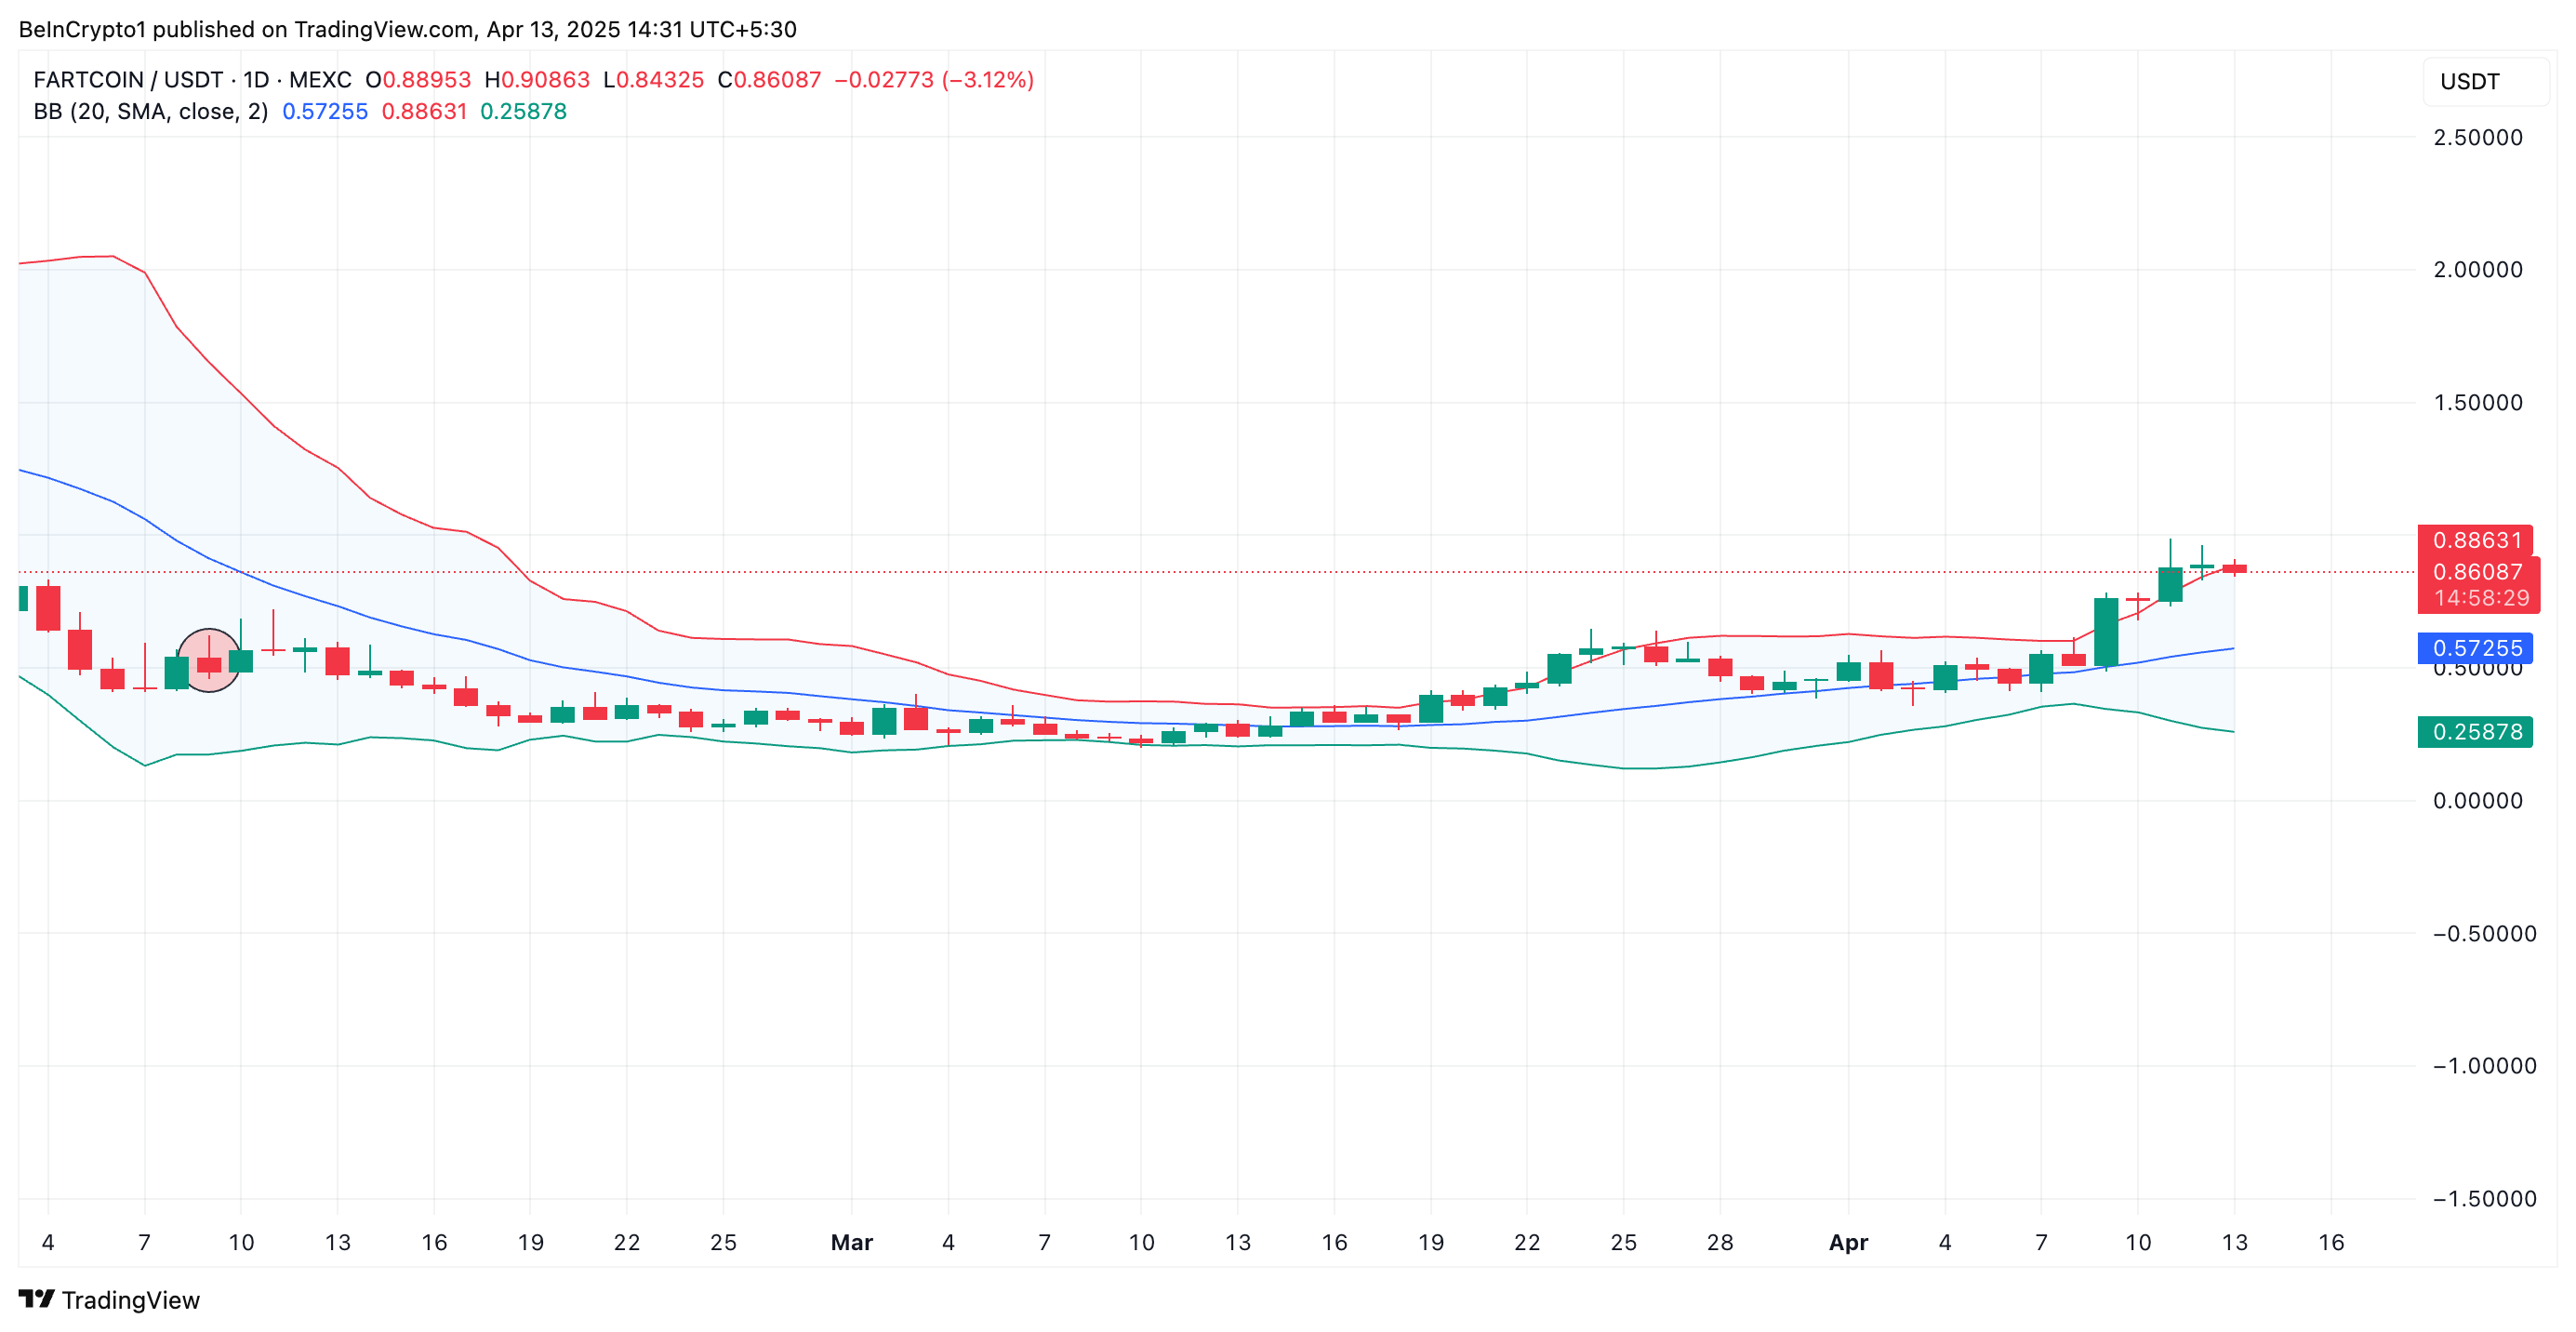 FARTCOIN Bollinger Bands. Source: TradingView
The BB indicator identifies overbought or oversold conditions and measures an asset’s price volatility. It consists of three lines: a simple moving average (middle band) and two bands (upper and lower) representing standard deviations above and below the moving average.
When the price breaks above the upper band, it means the asset’s current value is moving significantly away from its average, making it overbought and due for a price correction.
This pattern suggests that FARTCOIN’s current price level may not be sustainable, increasing the likelihood of a near-term pullback.
Moreover, readings from the token’s Relative Strength Index (RSI) confirm its nearly overbought status. At press time, this momentum indicator rests at 69.09.
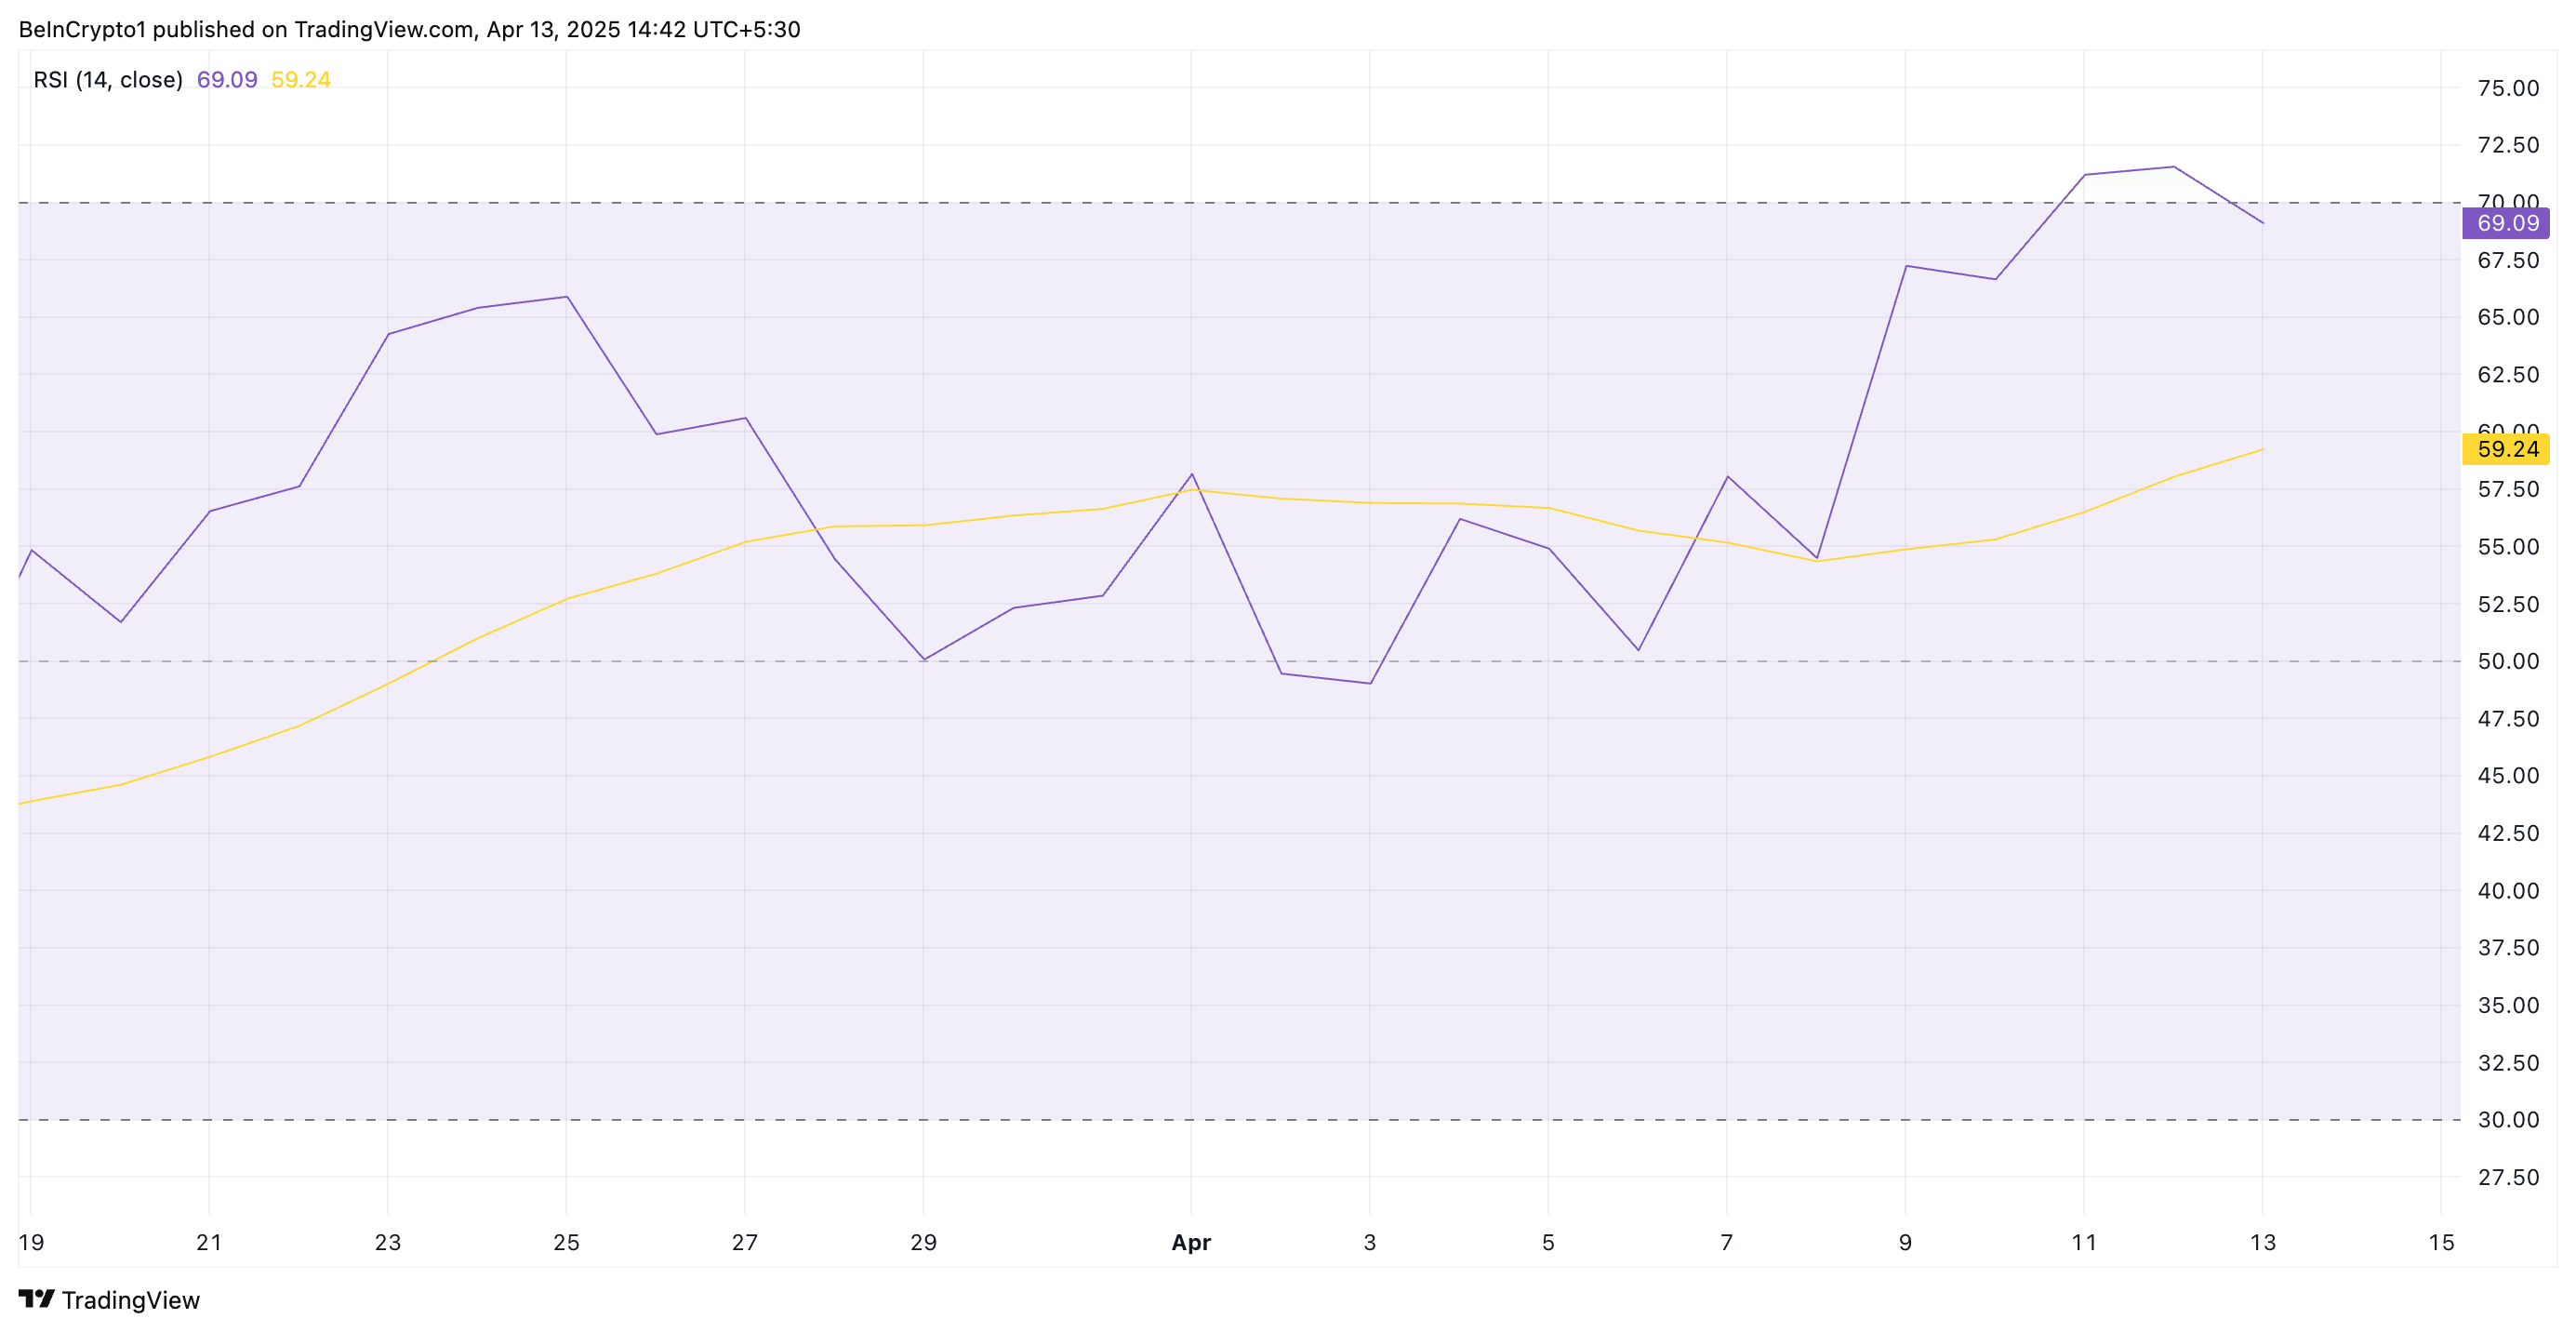 FARTCOIN RSI. Source: TradingView
The RSI indicator measures an asset’s overbought and oversold market conditions. It ranges between 0 and 100. Values above 70 suggest that the asset is overbought and due for a price decline, while values under 30 indicate that the asset is oversold and may witness a rebound.
At 69.09, FARTCOIN’s RSI signals that the meme coin is nearly overbought. Its upward momentum may be weakening, and a price correction could be near.
Will It Hit $1.16 or Slip Back to $0.37?
If the current momentum fades, FARTCOIN could face a short-term correction that causes it to shed some recent gains. In that scenario, the Solana-based asset could retest support at $0.74.
Should it fail to hold, the downtrend strengthens and could continue toward $0.37.
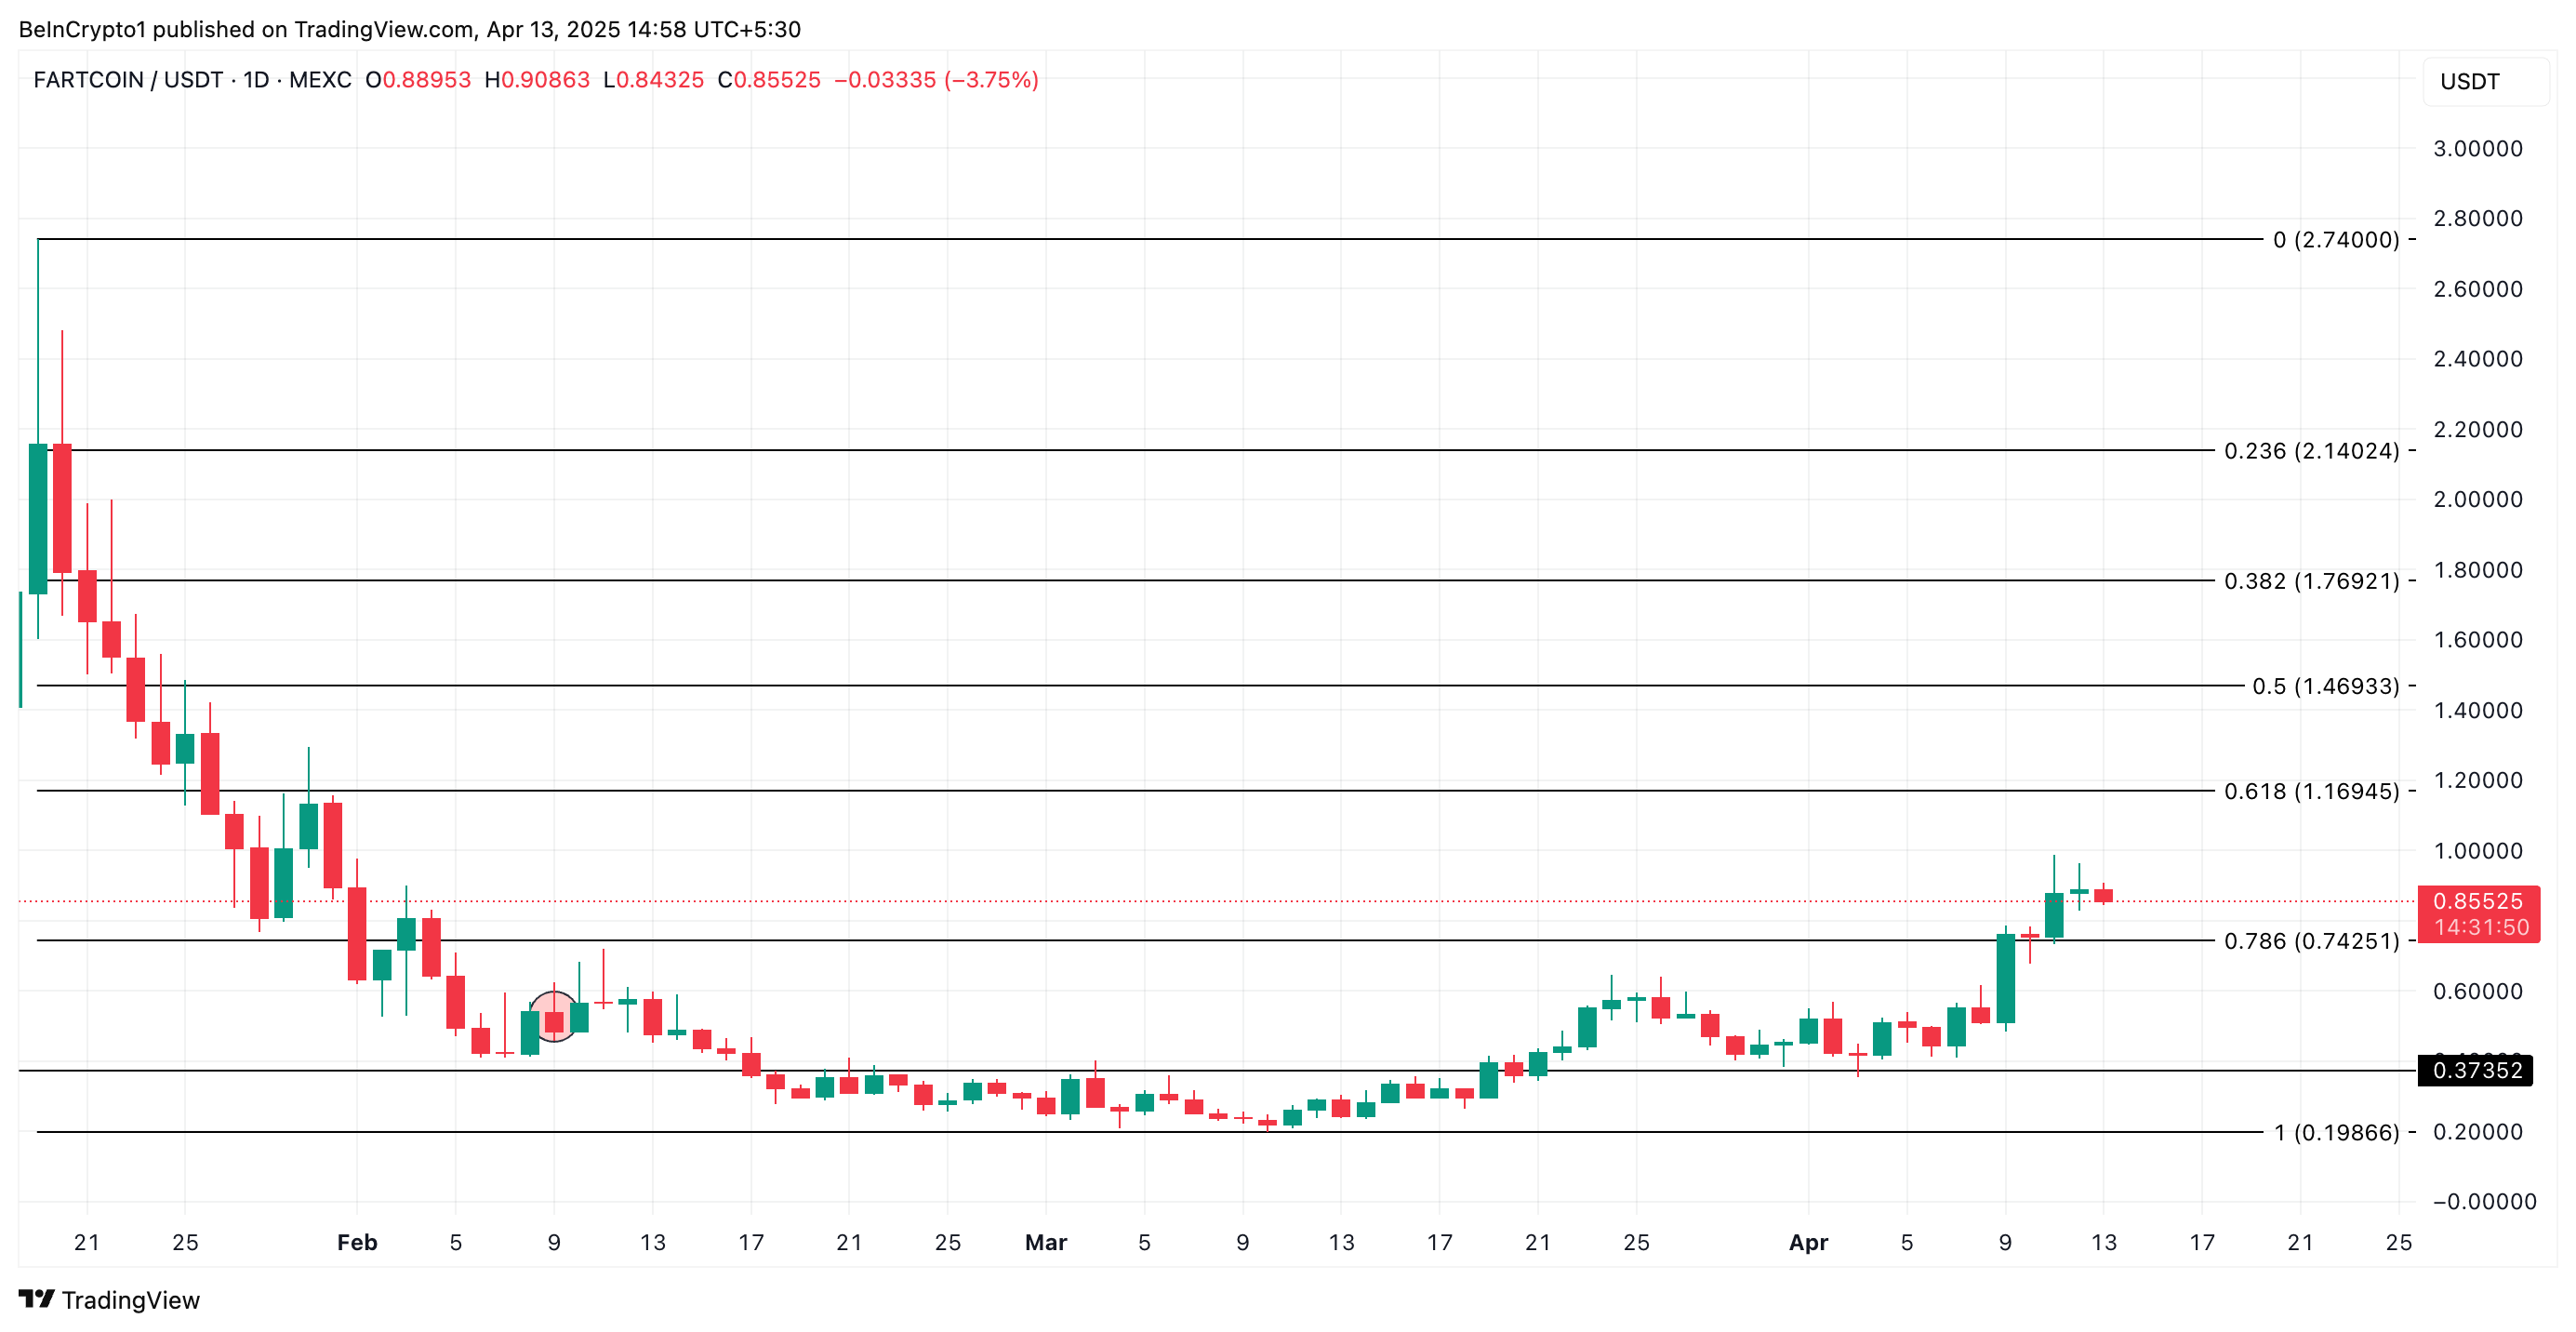 FARTCOIN Price Analysis. Source: TradingView
However, if FARTCOIN maintains its uptrend, it could rally to $1.16.
Recommended Articles


