


SEC approval of spot BTC ETFs was Bitcoin IPO, says expert
- Bitcoin price tagged $64,000 on Wednesday amid a buying frenzy and depleted OTC supplies.
- ETF specialist attributes the surge to ETFs, which brought BTC to Wall Street.
- The ETF craze has seen trading volumes beat their previous peaks.
Bitcoin (BTC) price exploded to an intraday high of $64,000 on Wednesday before a quick retraction. Reports circulated that over-the-counter (OTC) BTC supplies depleted, which could compel institutions to switch to public exchanges as an alternative source of Bitcoin.
Also Read: Bitcoin price rally likely not over as institutions deplete BTC OTC supply
ETF approval brought Bitcoin to Wall Street
Eric Balchunas, an exchange-traded funds (ETF) specialist with Bloomberg Intelligence, says that the approval of ETFs on January 10 acted as the Initial Public Offering (IPO) for Bitcoin.
For the layperson, an IPO is when a private company’s shares are made available to the public for the first time, effectively allowing a company to raise equity capital from public investors.
Balchunas’ report comes after ETF products broke their own record, surpassing their previous daily peak in trading volume to hit $2.6 billion on Wednesday. Notably, this record happened only halfway through the trading day.
Four BTC ETFs merit inclusion in the top 20 ETF list, and BlackRock’s IBIT takes fourth place overall. With such an explosive turnout before the end of business, Balchunas speculated there could be “more [trading volume] today than in its first two weeks combined.”
With the landmark approval of BTC ETFs on January 10, BTC came to Wall Street. It was easily accessible to institutions over-the-counter (OTC) for the first time. The capital inflows from these players catapulted Bitcoin price to scrape $64,000 on Wednesday. A trader and analyst on X, @DaanCrypto, wrote, “Must be one of the craziest runs I've seen on Bitcoin throughout my last [seven] years in Crypto.”
To put it in perspective, Bitcoin price managed to breach four thresholds in a single day, moving past $60,000 to $64,000.
At the time of writing, Bitcoin price is trading for $60,650 after filling the orders of longs when it dipped into the supply zone between $62,905 and $68,212. The level to beat is the midline of this order block at $65,654, beyond which the continuation of the intermediate trend would be confirmed.
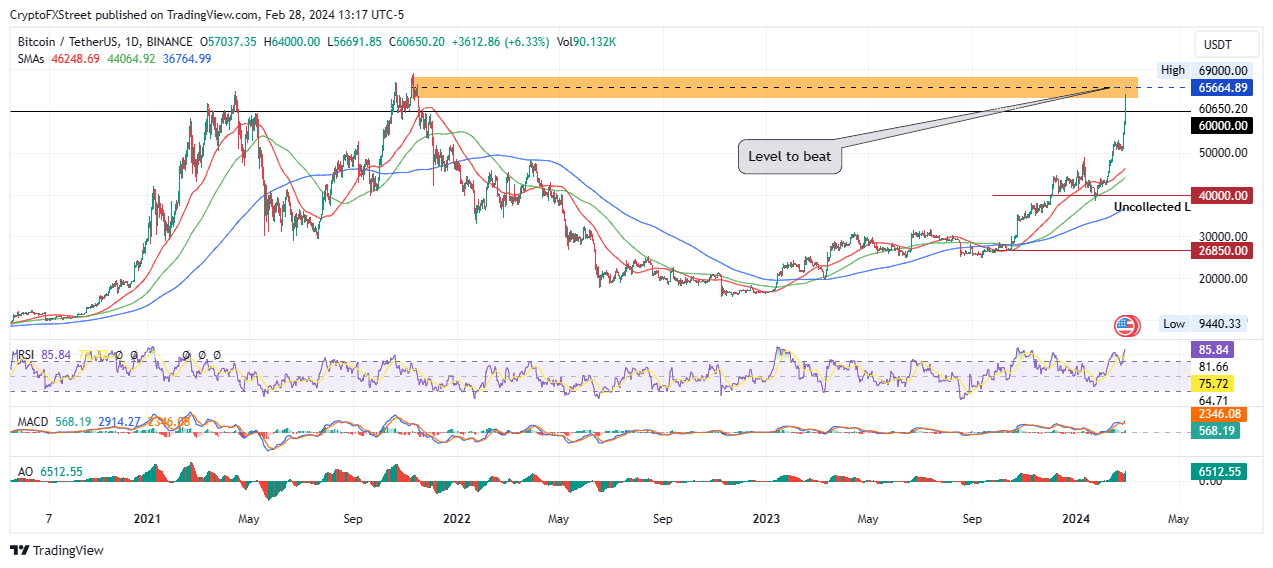
BTC/USDT 1-day chart
According to Balchunas, the overflows from the spot BTC ETF market are now spilling into the BTC futures ETF and stock markets.
Bitcoin, altcoins, stablecoins FAQs
What is Bitcoin?
Bitcoin is the largest cryptocurrency by market capitalization, a virtual currency designed to serve as money. This form of payment cannot be controlled by any one person, group, or entity, which eliminates the need for third-party participation during financial transactions.
What are altcoins?
Altcoins are any cryptocurrency apart from Bitcoin, but some also regard Ethereum as a non-altcoin because it is from these two cryptocurrencies that forking happens. If this is true, then Litecoin is the first altcoin, forked from the Bitcoin protocol and, therefore, an “improved” version of it.
What are stablecoins?
Stablecoins are cryptocurrencies designed to have a stable price, with their value backed by a reserve of the asset it represents. To achieve this, the value of any one stablecoin is pegged to a commodity or financial instrument, such as the US Dollar (USD), with its supply regulated by an algorithm or demand. The main goal of stablecoins is to provide an on/off-ramp for investors willing to trade and invest in cryptocurrencies. Stablecoins also allow investors to store value since cryptocurrencies, in general, are subject to volatility.
What is Bitcoin Dominance?
Bitcoin dominance is the ratio of Bitcoin's market capitalization to the total market capitalization of all cryptocurrencies combined. It provides a clear picture of Bitcoin’s interest among investors. A high BTC dominance typically happens before and during a bull run, in which investors resort to investing in relatively stable and high market capitalization cryptocurrency like Bitcoin. A drop in BTC dominance usually means that investors are moving their capital and/or profits to altcoins in a quest for higher returns, which usually triggers an explosion of altcoin rallies.
Recommended Articles


