


Cardano (ADA) Indicators Show Mixed Signals As Its Price Falls Almost 5%
Cardano (ADA) is facing renewed pressure, dropping nearly 5% on Wednesday. ADA trading volume has also slipped 19% to $751 million. Despite this pullback, some indicators are beginning to flash early signs of potential trend shifts.
The BBTrend has turned positive for the first time in over a week, hinting at a possible change in momentum, while the DMI shows that ADA may be consolidating after a sharp move.
Cardano BBTrend Is Now Positive, But Still At Low Levels
Cardano’s BBTrend indicator is currently at 2.25, marking its highest reading since March 8. For the past nine days, since March 18, the BBTrend remained negative or hovered near zero, even reaching a low of -2.14 on March 19.
This recent uptick suggests a shift in market behavior, as the indicator moves out of neutral-to-bearish territory and into a more positive trend structure.
While 2.25 isn’t an extreme reading, it does signal that momentum is beginning to tilt in favor of buyers after a prolonged period of indecision or weakness.
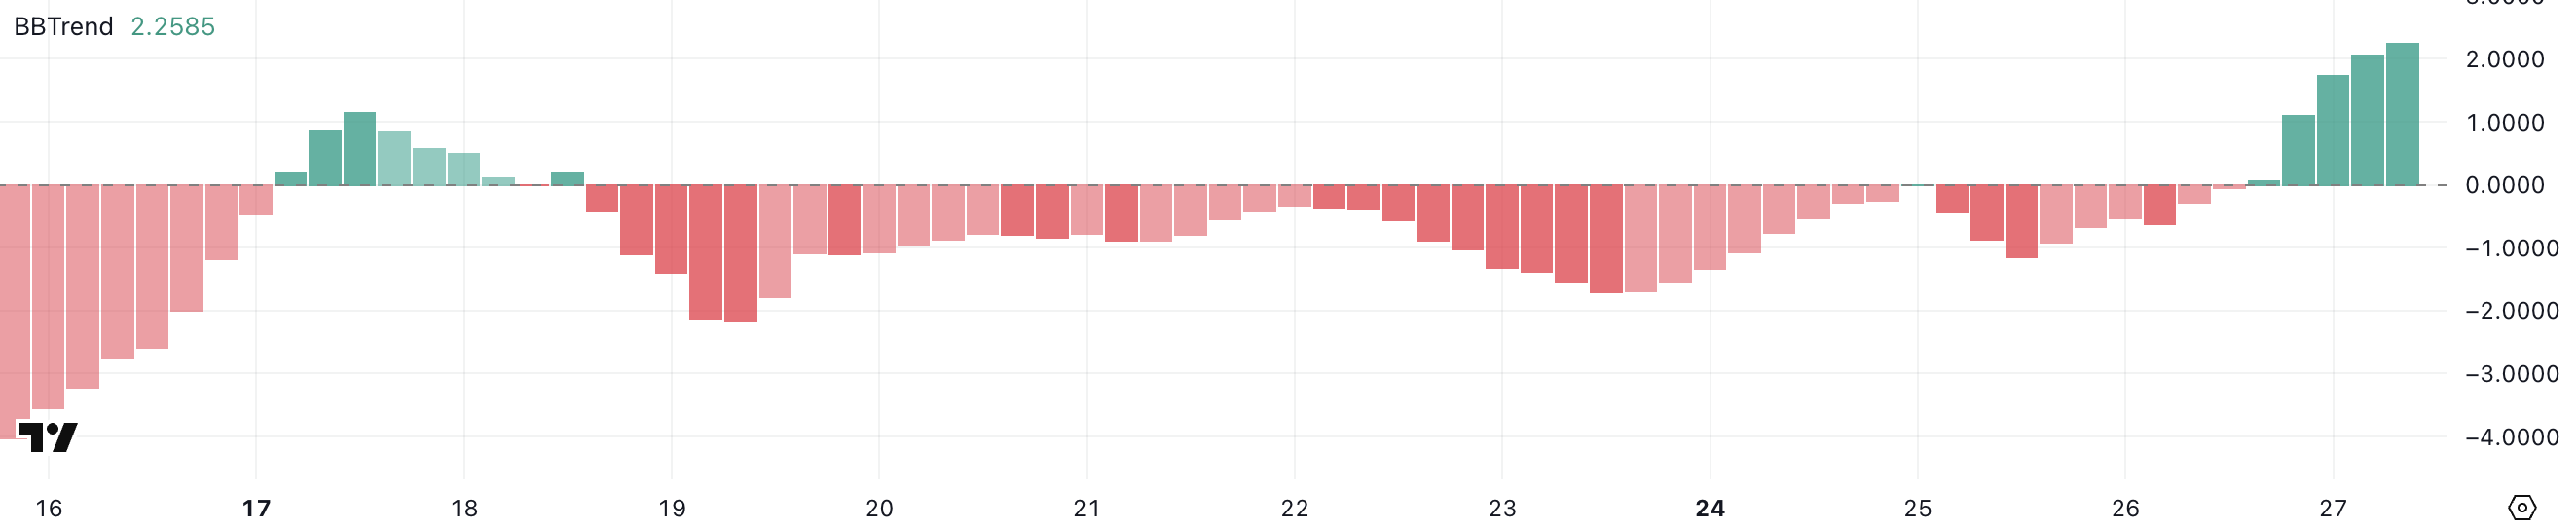 ADA BBTrend. Source: TradingView.
The BBTrend, or Bollinger Band Trend indicator, measures the strength and direction of a trend based on price behavior relative to the Bollinger Bands.
Values above zero generally point to bullish conditions, while values below zero suggest bearish sentiment. A reading of 2.25 indicates that price is starting to trend upward with growing volatility expansion—though not yet at strong trend levels, it marks a notable improvement.
If the BBTrend continues to rise, it could support the development of a more sustained uptrend for ADA, especially if accompanied by increased volume and a break above key resistance levels.
ADA DMI Shows The Consolidation Could End Soon
Cardano’s DMI chart shows that the Average Directional Index (ADX) has dropped to 17, a sharp decline from 25.79 just a day earlier. This suggests a significant weakening in trend strength following yesterday’s rapid price surge and subsequent drop.
The ADX is a key component of the DMI system and is used to gauge the strength of a trend—regardless of direction.
Typically, an ADX below 20 signals a lack of strong trend or consolidation, while readings above 25 indicate a more established trend gaining traction.
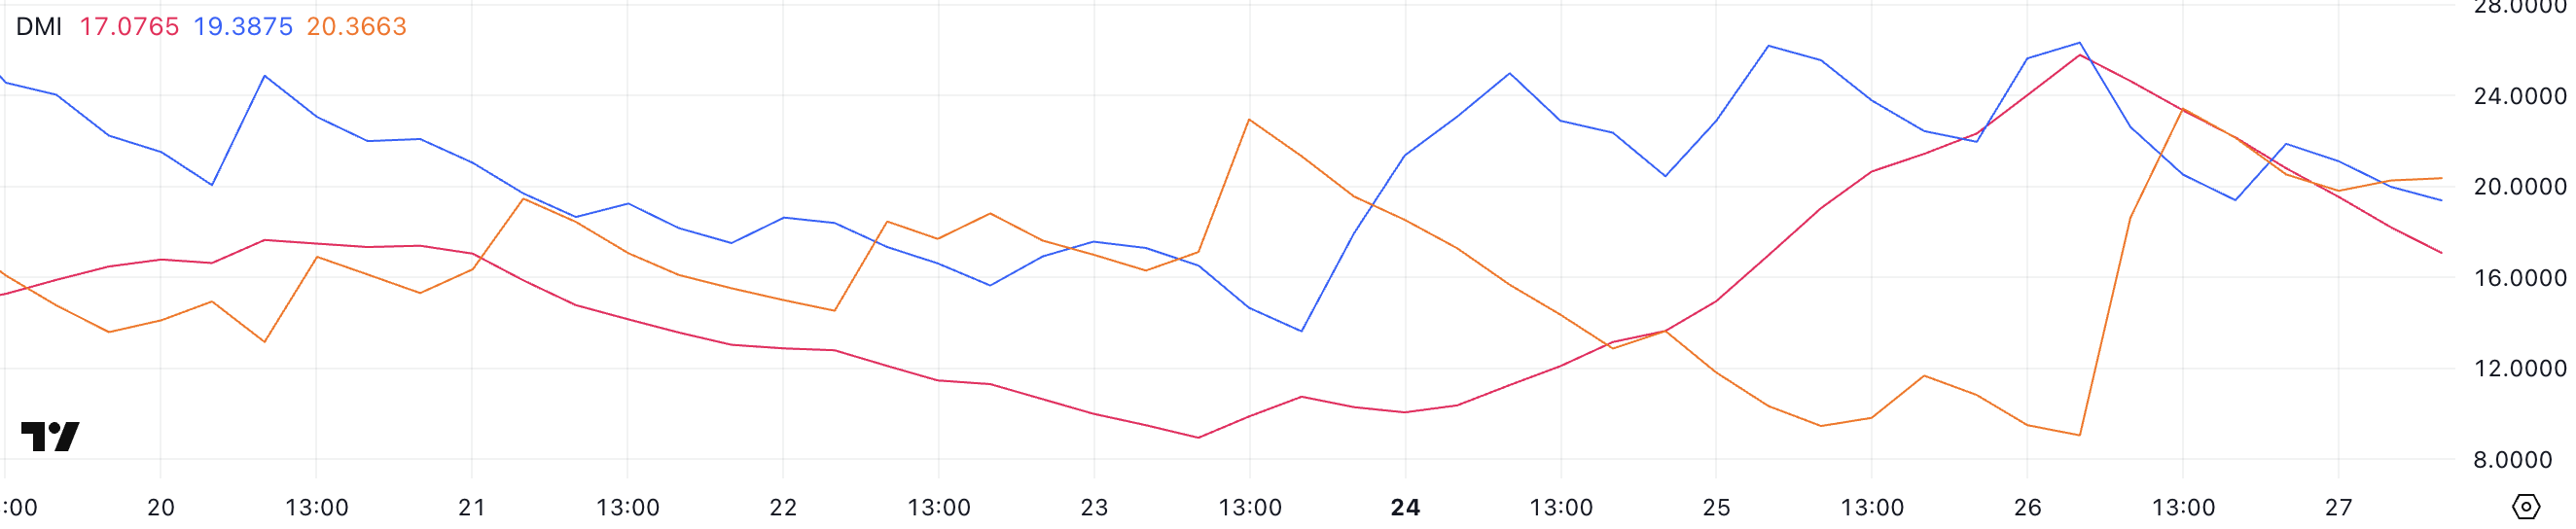 ADA DMI. Source: TradingView.
Alongside the ADX, the +DI (Positive Directional Indicator) and -DI (Negative Directional Indicator) provide insight into the direction of momentum. Currently, +DI has fallen to 19.38 from 26.33, while -DI has surged to 20.36 from 9.
This crossover suggests that sellers are beginning to take control, even as the overall trend weakens.
With both the ADX trending downward and the DI lines crossing in favor of the bears, this suggests a market in consolidation but with increasing downside pressure. Unless momentum shifts again, ADA may struggle to regain upward traction in the short term.
Can Cardano Return To $1 Before April?
Cardano’s DMI lines suggest the asset is undergoing a correction following a failed attempt to break above the key resistance level at $0.77.
This rejection has shifted momentum, and if Cardano’s price continues to drop, the next area to watch is the support around $0.69. Should that level fail to hold, it could trigger further downside movement, potentially pushing ADA down to the $0.64 range.
The DMI’s directional shift supports this short-term bearish view, with sellers gradually gaining strength as buyers lose momentum.
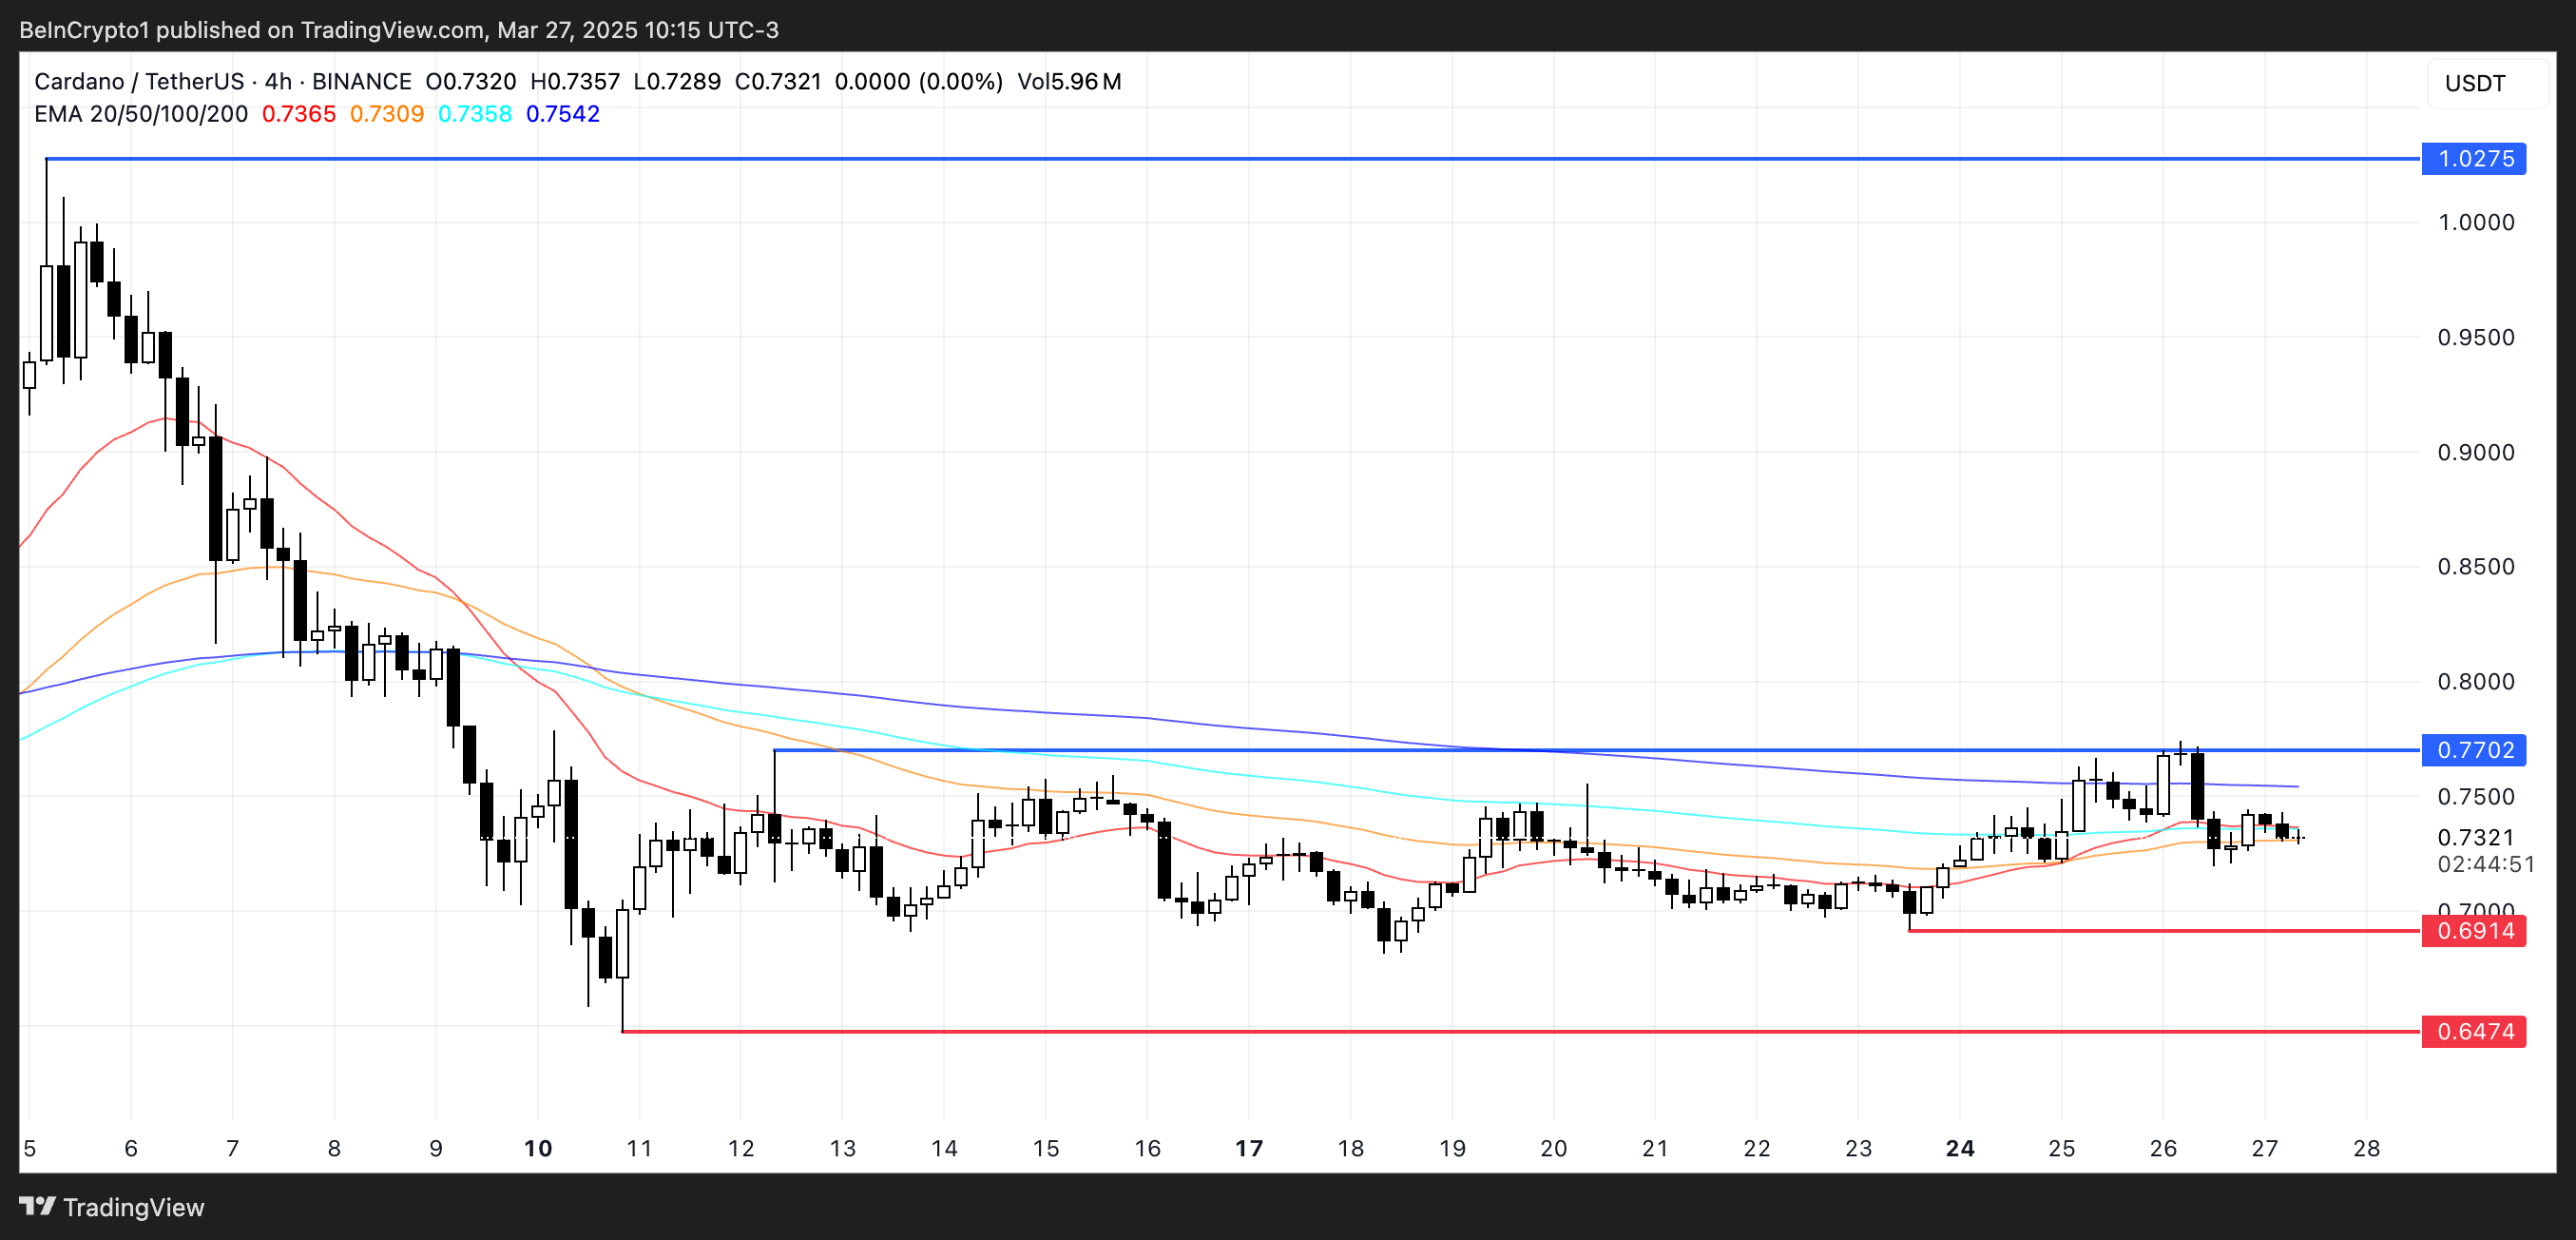 ADA Price Analysis. Source: TradingView.
However, if ADA can reclaim its upward momentum, there’s still room for a bullish reversal. A renewed push toward the $0.77 resistance level could bring a breakout scenario back into play.
If that level is breached with strong volume, it could open the door for a rally toward the $1.02 region—taking Cardano above the $1 mark for the first time since early March.
Such a breakout would likely be supported by a bullish crossover in the DMI lines and a strengthening ADX, confirming a new upward trend.
Recommended Articles


