

HYPE Drops 14% After JELLY Short Squeeze: Is Hyperliquid Safe for Users?
Hyperliquid (HYPE) is facing heavy selling pressure after a major short squeeze of the JELLY meme coin triggered widespread concerns across the platform. A whale manipulation led to nearly $12 million in losses for Hyperliquidity Provider (HLP), forcing the exchange to delist the token.
Following the exchange’s actions, market confidence took a hit, causing HYPE to drop over 14% in the past 24 hours. With its market cap now below $5 billion, will HYPE continue to slump?
JELLY Delisting Crashes Hyperliquid Price
Hyperliquid is under intense scrutiny after a whale holding 124.6 million JELLY began manipulating the token’s price to exploit Hyperliquidity Provider (HLP).
The whale first dumped the tokens, crashing the price and forcing HLP into a massive passive short. Then, by rebuying and driving the price back up, the whale triggered a loss of nearly $12 million for HLP.
This exploit sparked major concerns around the platform’s risk exposure and security mechanisms.
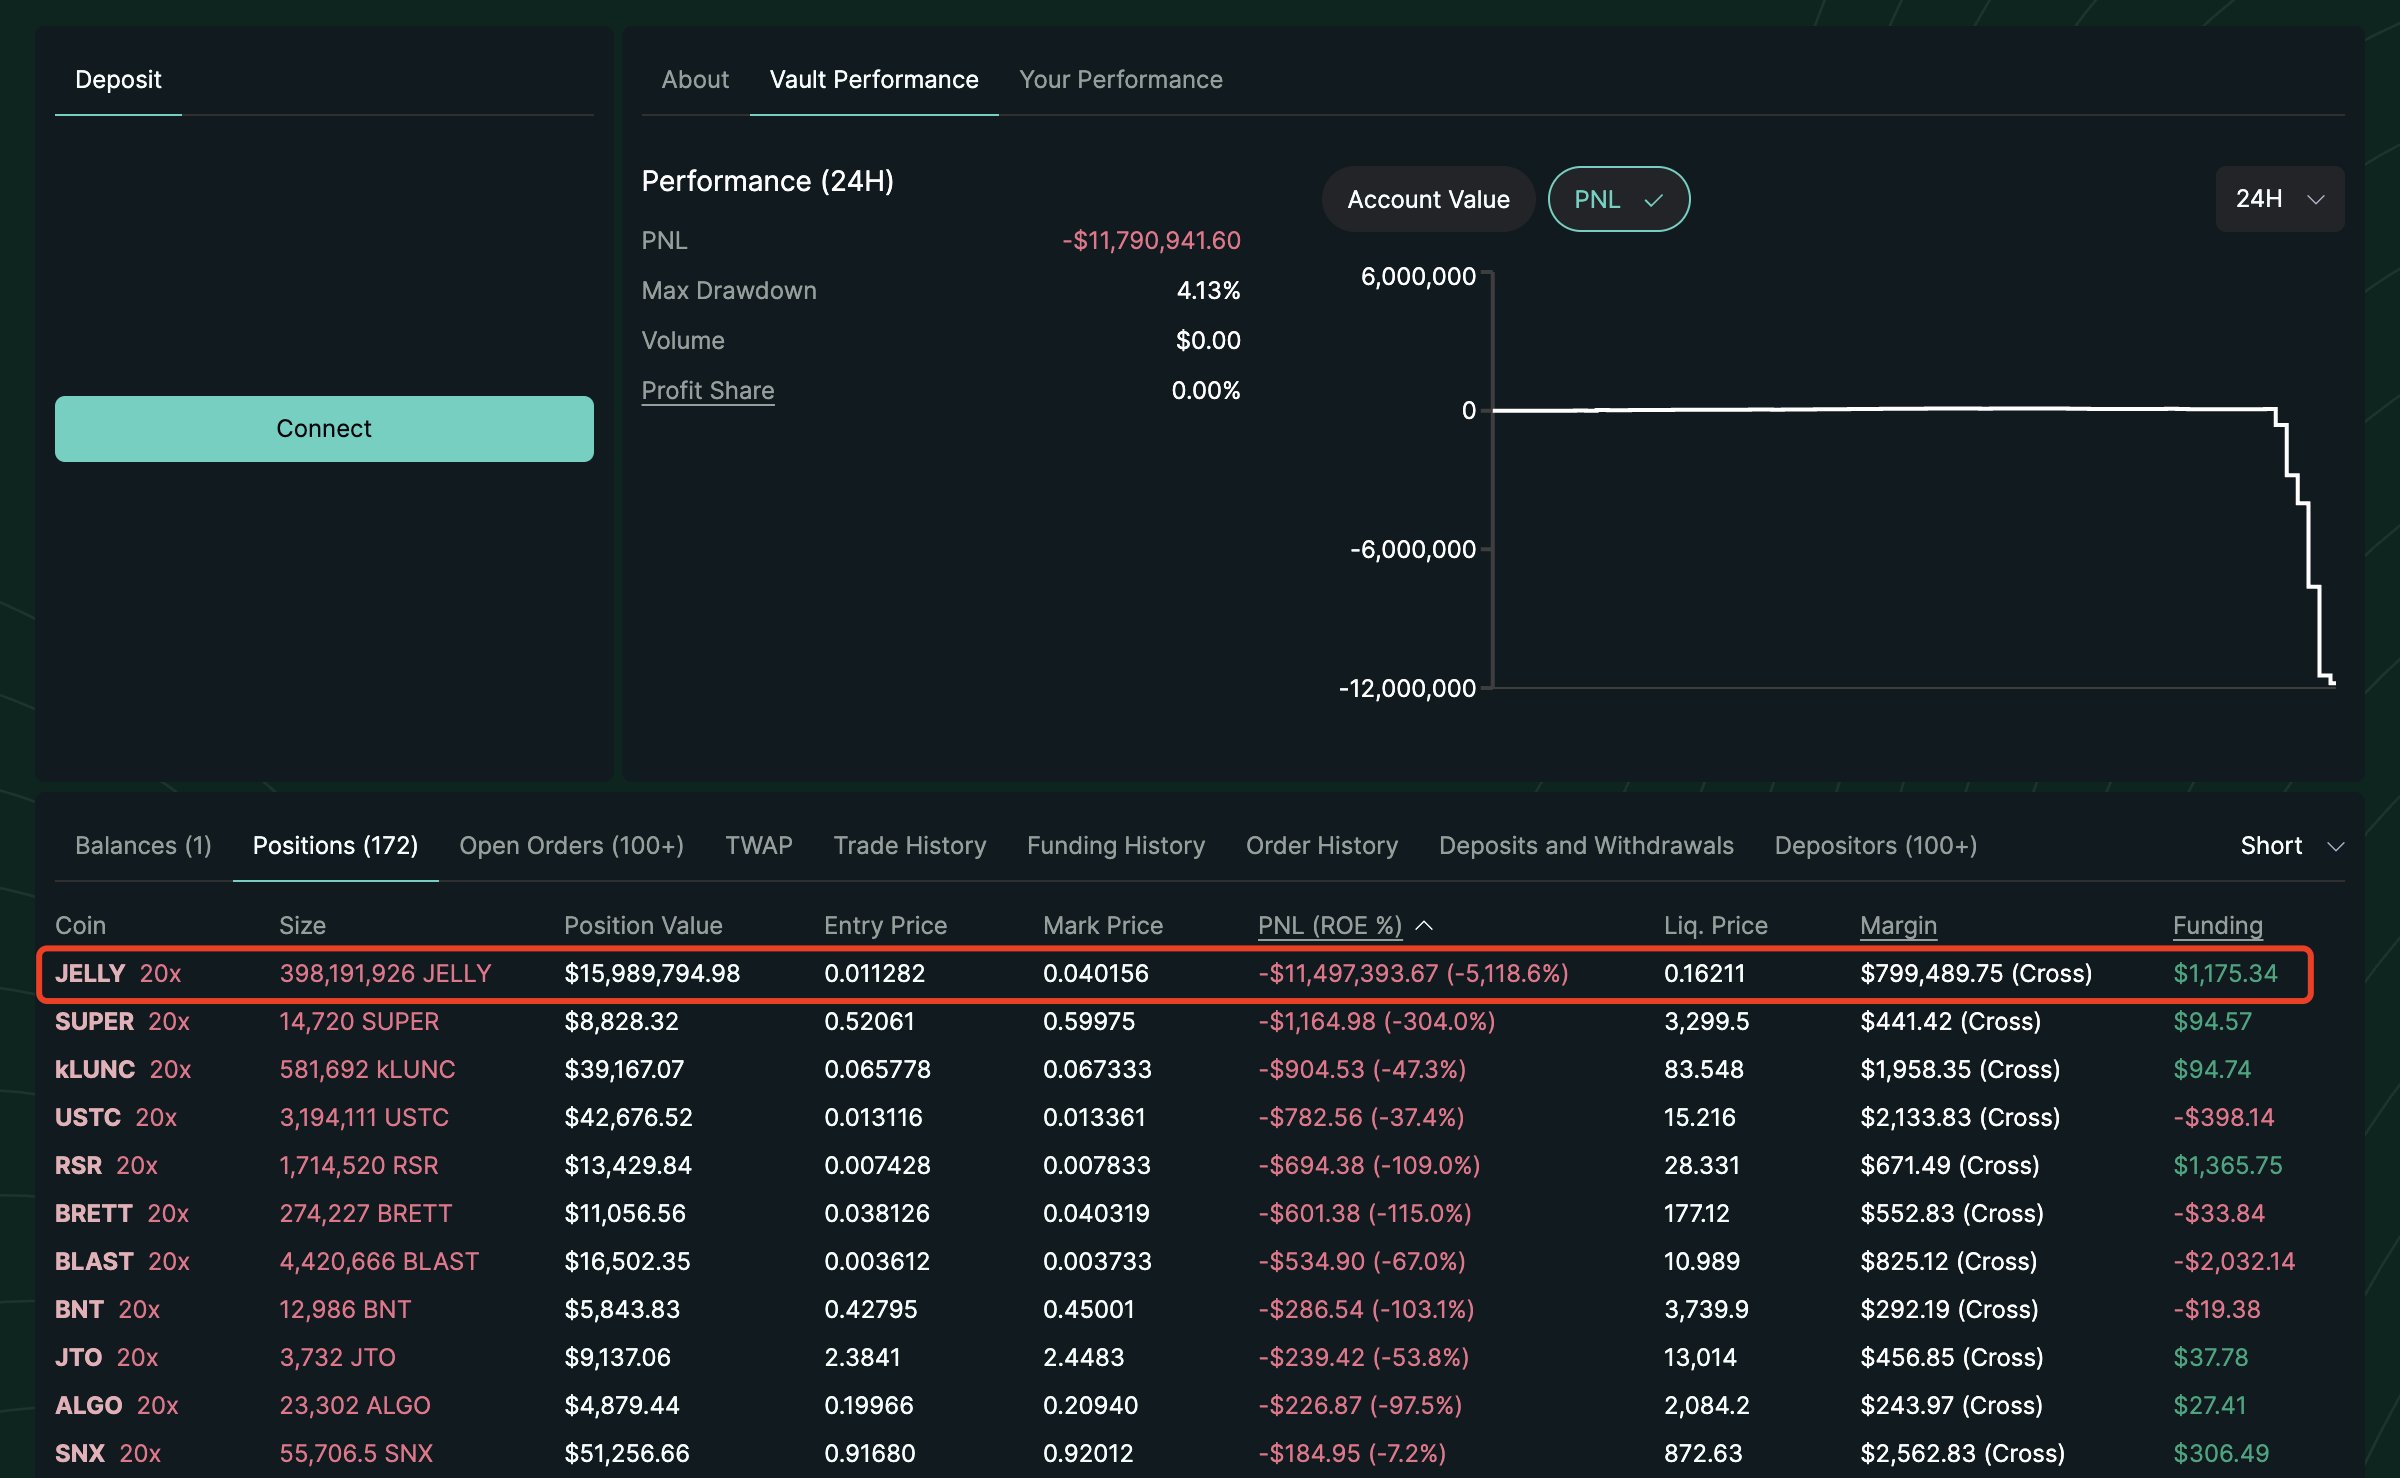 Hyperliquid Provider Losses. Source: Lookonchain on X.
In response, Hyperliquid announced the delisting of JELLYJELLY to prevent what could have become a $230 million loss.
However, the damage to investor confidence was already done, causing HYPE’s price to drop over 10% in the past 24 hours. Its market cap has now fallen below $5 billion as the market reacts to fears of further instability and the potential for similar exploits.
HYPE Indicators Show The Impact Of The News
HYPE’s RSI has dropped to 36.27, down sharply from 71 just two days ago. This decline reflects a rapid shift in momentum following the exploit news that sent the price lower after a brief recovery attempt.
The RSI (Relative Strength Index) measures price momentum on a scale from 0 to 100. Readings above 70 signal overbought conditions, while values below 30 suggest oversold territory. Levels between 30 and 50 indicate bearish pressure.
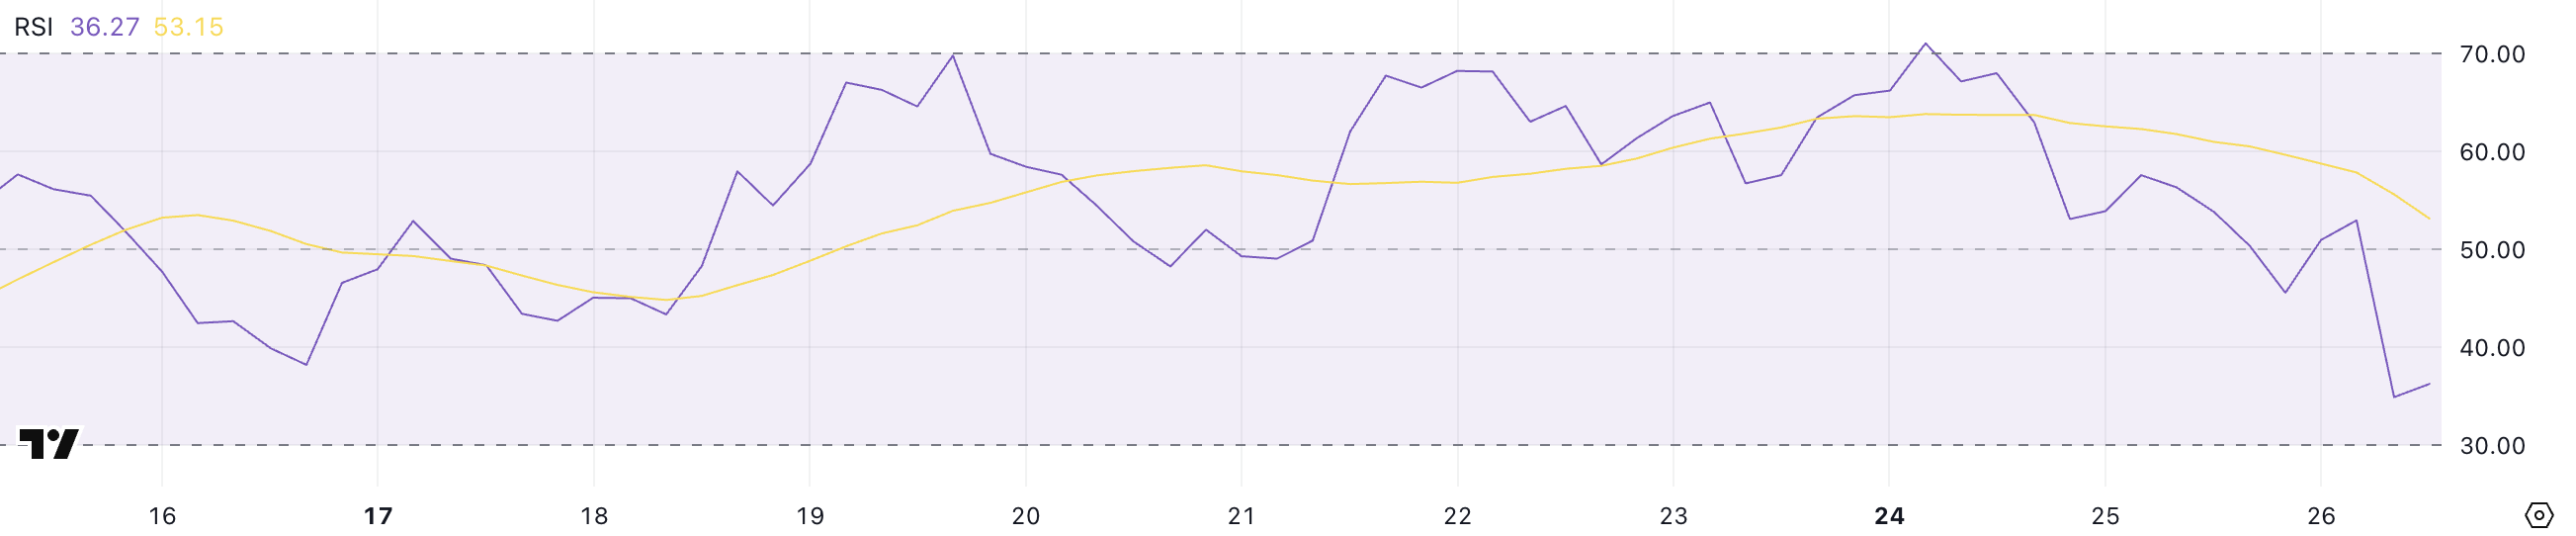 HYPE RSI. Source: TradingView.
With RSI now at 36.27, HYPE is approaching oversold levels, suggesting sellers have taken control. While not extreme yet, it signals weakness and could point to further downside if sentiment doesn’t improve.
Meanwhile, HYPE’s BBTrend dropped from 10 to 6.97 after the exploit but has remained in positive territory for six straight days. BBTrend, or Bollinger Band Trend, measures the strength of price trends based on the expansion of Bollinger Bands.
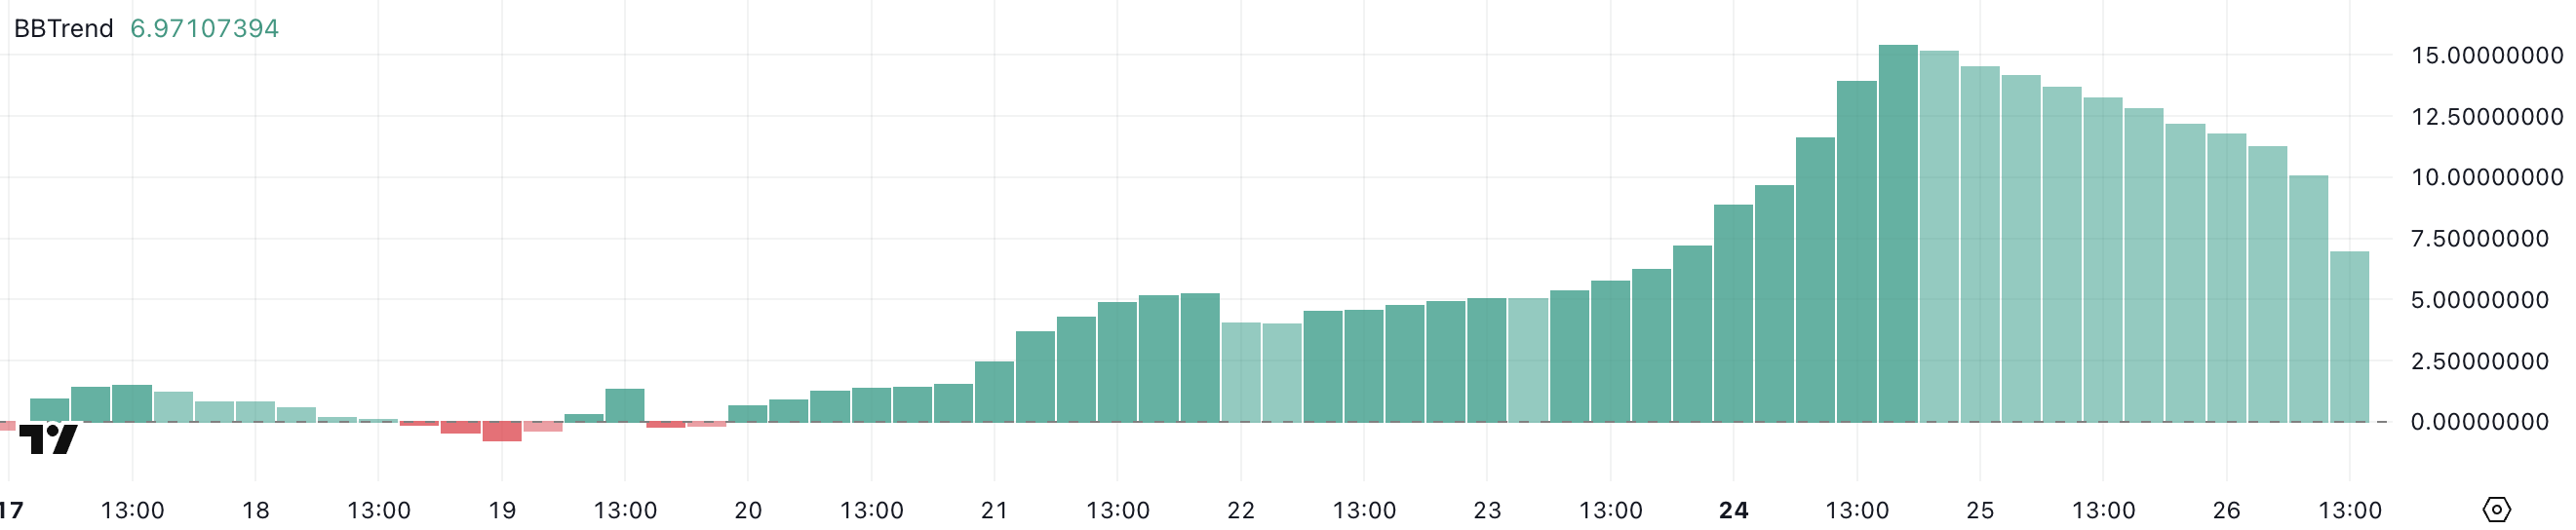 HYPE BBTrend. Source: TradingView.
Values above 3 show strong momentum, while those below 1 suggest sideways action. The drop from 10 to under 7 shows trend strength is weakening, but still intact.
If BBTrend continues to fall, it may confirm a slowdown in bullish momentum. Combined with the low RSI, this could keep HYPE under pressure unless a reversal takes shape.
Can Hyperliquid Recover From The Crash?
If the current correction continues, HYPE could soon test the key support at $13.91. This move could be accelerated by the formation of a death cross, which the EMA lines suggest may happen soon.
Losing the $13.91 level would likely add more selling pressure. The next supports are $12.82 and $12.06. A break below those could deepen the downtrend further.
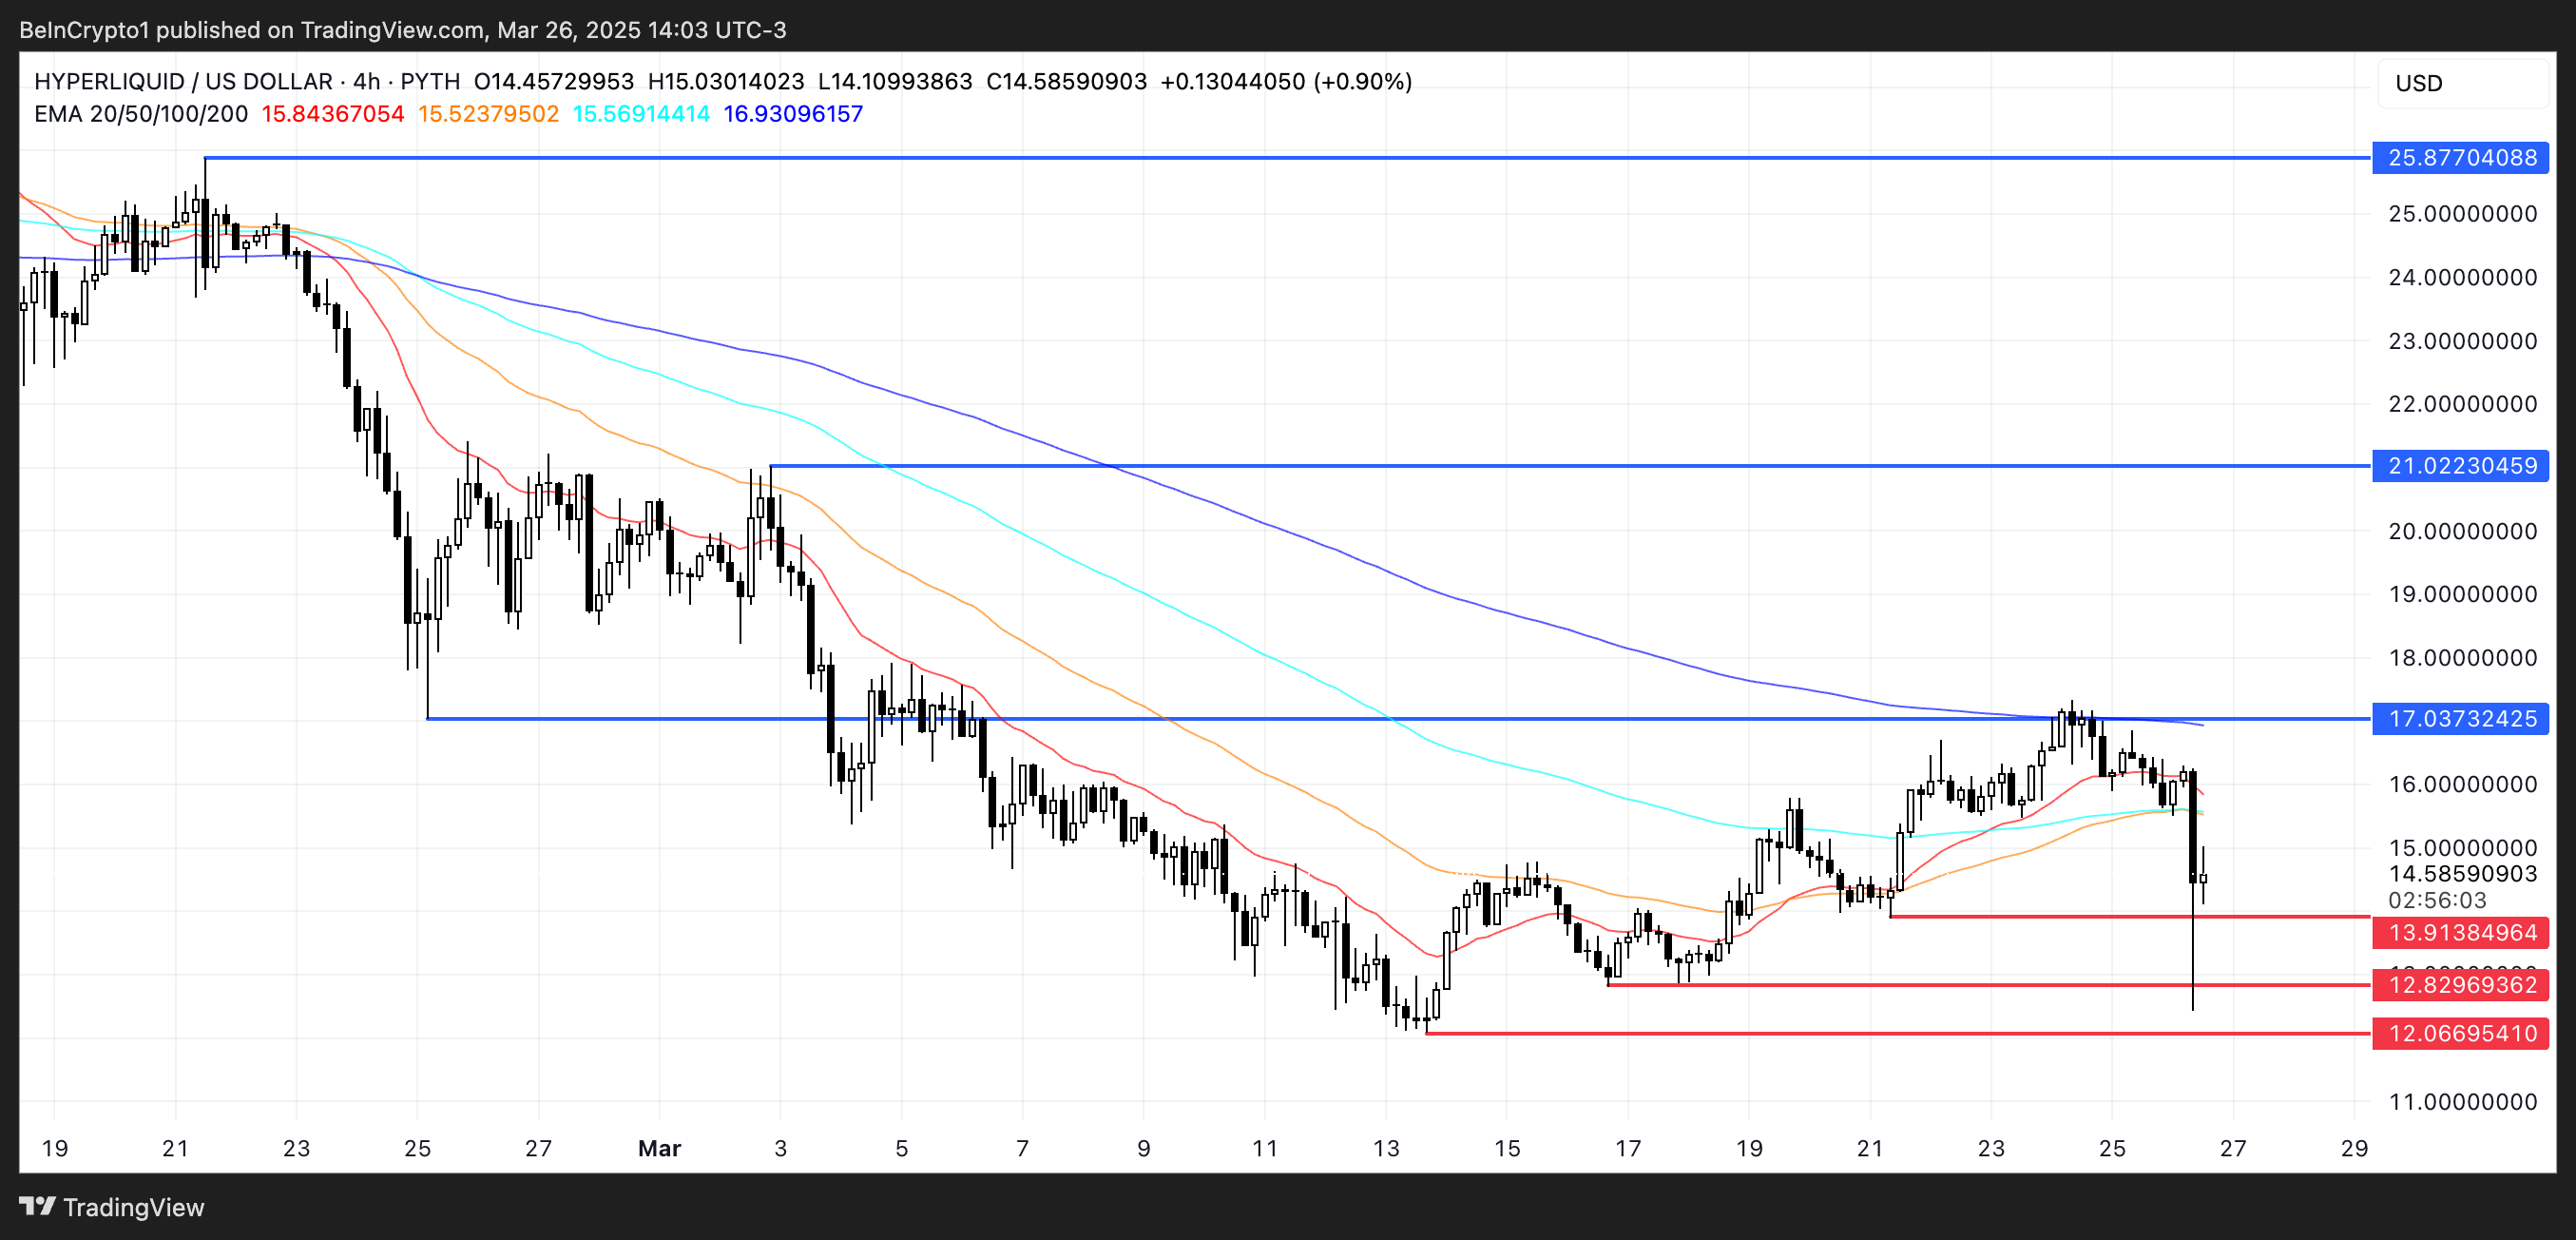 HYPE Price Analysis. Source: TradingView.
On the flip side, if HYPE can recover from the recent negative sentiment, it may retest the $17.03 resistance. It attempted this level just three days ago but failed to break through.
If $17.03 is broken and momentum builds, HYPE could push higher to $21, and even $25.87. That would mark its first time trading above $24 since February 22.
Recommended Articles


