


Whale dumps HYPE for USDC losing $1.8M, other whales go long on ETH and HYPE
A cryptocurrency whale tracked by Lookonchain liquidated its entire Hyperliquid (HYPE) holdings after swapping over $5 million worth of USDC to buy the tokens, selling them at a significant loss. Another trader has profited from leveraged positions on the same token and Ethereum (ETH).
In a March 14 X post, on-chain analytics platform Lookonchain reported that a whale sold off their entire HYPE holdings, losing more than $1.8 million in the process. Between February 25 and March 4, the investor spent 5.08 million USDC to acquire 266,000 HYPE at an average price of $19.08 per token.
About 11 hours before Lookonchain’s update, they sold their holdings for 3.27 million USDC at an average price of $12.27 per token to make the realized losses. The trader could have decided to let go of his holdings owing to the weeks of HYPE’s downtrend, which has seen its price decline by 28.7% over the last two weeks, per CoinGecko data.
Whale cashes out profits on Hyperliquid and Ethereum
Not everyone felt the effects of HYPE’s weekly bloodbath, as another trader has counted a month of gains, making leveraged trades on the Hyperliquid platform. According to Lookonchain, this individual has made a total profit of $16.39 million from February 14 to date, through eight trades across two wallets, with every single transaction proving profitable.
The market tracker’s chart analysis shows that they made the most money from March 1 to March 3. The whale deposited about $6.5 million on Hyperliquid and withdrew $13.74 million by longing Bitcoin, Ethereum, and Yield Guild Games (YGG). During those 48 hours, YGG went up 38%, and BTC went from about $85,000 to $93,000.

This investor went long on both ETH and HYPE around 9 p.m. UTC on Thursday, making another $1.18 million.
HYPE selling pressures soar, indicators largely bearish
The coin’s temporary rebound to $14.85 three days ago was not enough to push the token to a rally, and it continues to flash red. The crypto reached an all-time high level at $34.96 last December, but has now fallen below the $15 mark, as bears continue to push the boundaries of the bulls’ territory.
The ongoing sell-off has pushed HYPE into extremely oversold territory. The token’s Relative Strength Index (RSI) currently sits at 9.94, an indication of severe overselling. Its strong Average Directional Index (ADX) reading of 100 suggests that bearish momentum remains dominant, leaving little room for an immediate recovery.
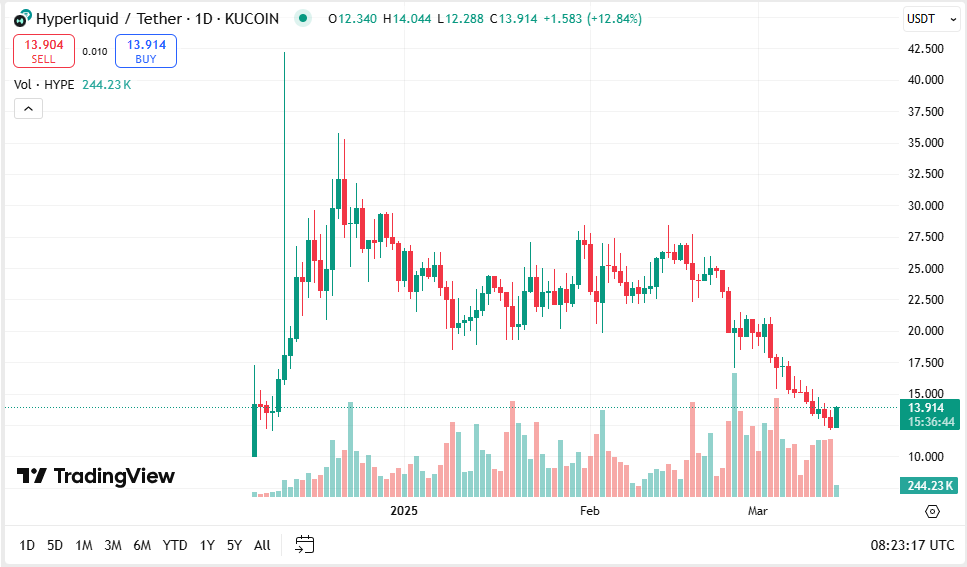
Investors may have a reason to smile after the token went up by 10.7% in the last 24 hours, but their hopes for a more defined price uptrend is thwarted by a negative 14.49% momentum reading on the monthly chart. Trading volume remains below average at 0.72x, indicating that buyers are hesitant to step in.
Per TradingView’s technical indicators, HYPE’s 10-day exponential moving average stands at 14.577, while the simple moving average for the same period is at 14.346, both spelling bearish conditions.
Longer-term moving averages, including the 30-day and 50-day, remain well above current price levels, with the simple 50-day moving average sitting at 21.481, showing that HYPE is trading well below historical support levels.
For any potential recovery, traders will be watching the $12.69 pivot level as a threshold to push its price up. Short-term resistance is expected at $13.23 and $14.14, which could limit any upward movement, while a more substantial resistance zone begins at $21.03.
Conservative traders may prefer to wait for stronger confirmation of a reversal, which would require the RSI to recover above 30, a decisive break above the $12.69 pivot, and a notable increase in trading volume beyond the daily average. Until these conditions are met, HYPE bears will still have control over the market, with no clear signs of immediate recovery.
Cryptopolitan Academy: Tired of market swings? Learn how DeFi can help you build steady passive income. Register Now
Recommended Articles


